<?xml version="1.0" encoding="utf-8"?><feed xmlns="http://www.w3.org/2005/Atom" ><generator uri="https://jekyllrb.com/" version="3.10.0">Jekyll</generator><link href="https://nnethercote.github.io/feed.xml" rel="self" type="application/atom+xml" /><link href="https://nnethercote.github.io/" rel="alternate" type="text/html" /><updated>2026-07-31T08:13:59+00:00</updated><id>https://nnethercote.github.io/feed.xml</id><title type="html">Nicholas Nethercote</title><subtitle>Be kind and be useful.</subtitle><entry><title type="html">How to speed up the Rust compiler in July 2026</title><link href="https://nnethercote.github.io/2026/07/31/how-to-speed-up-the-rust-compiler-in-july-2026.html" rel="alternate" type="text/html" title="How to speed up the Rust compiler in July 2026" /><published>2026-07-31T00:00:00+00:00</published><updated>2026-07-31T00:00:00+00:00</updated><id>https://nnethercote.github.io/2026/07/31/how-to-speed-up-the-rust-compiler-in-july-2026</id><content type="html" xml:base="https://nnethercote.github.io/2026/07/31/how-to-speed-up-the-rust-compiler-in-july-2026.html"><![CDATA[<p>My <a href="https://nnethercote.github.io/2025/12/05/how-to-speed-up-the-rust-compiler-in-december-2025.html">last
post</a>
on the Rust compiler’s performance was in December 2025. Let’s see what has
happened since then.</p>

<h2 id="overall-progress">Overall progress</h2>

<p>The measurements for the period 2025-12-03 to 2026-07-29 can be seen
<a href="https://perf.rust-lang.org/compare.html?start=83e49b75e7daf827e4390ae0ccbcb0d0e2c96493&amp;stat=wall-time&amp;tab=compile&amp;end=1a833e16546c2eb012758ddd499964fd8afee29e&amp;nonRelevant=true">here</a>.</p>

<p>The mean wall-time reduction was a healthy 5.59%. Around half of this was due
to some huge recent improvements in rustdoc, which saw a mean wall-time
reduction of 37.92%! With the rustdoc changes excluded,
the mean wall-time change was 2.90%, which is still a good result. There were
also some major improvements to the speed of Clippy, which isn’t currently
measured by rustc-perf on CI. (More about that below.)</p>

<h2 id="rustdoc">rustdoc</h2>

<p><a href="https://github.com/rust-lang/rust/pull/159623">#159623</a>,
<a href="https://github.com/rust-lang/rust/pull/159721">#159721</a>,
<a href="https://github.com/rust-lang/rust/pull/159779">#159779</a>,
<a href="https://github.com/rust-lang/rust/pull/159854">#159854</a>: In these PRs, <a href="https://github.com/camelid">Noah
Lev</a> greatly reduced the amount of work done when
processing impls. I won’t pretend to understand what he did in any more detail
than that (see
<a href="https://rust-lang.zulipchat.com/#narrow/channel/266220-t-rustdoc/topic/Is.20.60recursion_limit.60.20supposed.20to.20have.20cross-crate.20effects.3F">here</a>
for some background) but I do know it resulted in many double- and single-digit
percentage reductions in wall-times. Guillaume Gomez
<a href="https://mas.to/@imperio@toot.cat/117002726203860371">said</a> “all of that
because someone encountered a weird bug when using rustdoc”.</p>

<p><a href="https://github.com/rust-lang/rust/pull/159091">#159091</a>: In this PR <a href="https://github.com/Kobzol">Jakub
Beránek</a> added rustdoc benchmarks to the
<a href="https://en.wikipedia.org/wiki/Profile-guided_optimization">PGO</a> training set,
which lets rustdoc benefit more from PGO. This gave a mean 2.85% reduction in
wall-time across all the rustdoc benchmarks, with the largest reduction
exceeding 6%. PGO is fiddly to set up but it can really make a difference,
and the training set matters.</p>

<p><a href="https://github.com/rust-lang/rust/pull/157179">#157179</a>: In this PR I changed
the way rustdoc sorts impls. Previously it was sorting long generated HTML
strings containing impl names; now it uses a much shorter text representation
of the impl name as the sort key. This reduced instruction counts across
multiple benchmarks, in the best case by more than 6%.</p>

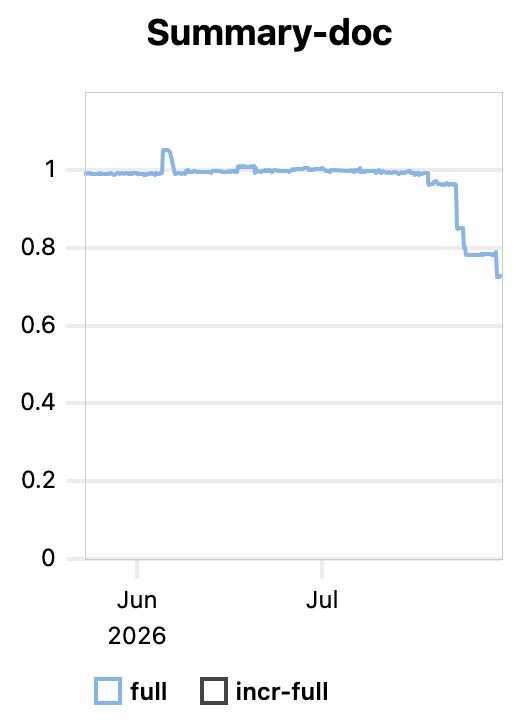
<p>The combined effect of these improvements can be seen in the following graph of
the relative wall-time of all the rustdoc benchmarks.</p>

<p align="center">
  <img src="/images/2026/07/31/rustdoc.png" width="300" />
</p>

<p>That’s a 28% reduction!</p>

<p><a href="https://github.com/rust-lang/rustc-perf/pull/2515">#2515</a>: On a different
note, in this PR Jakub enabled rustdoc-json benchmarking on rustc-perf. This
will be helpful for the speed of tools that use rustdoc’s JSON output, such as
cargo-semver-checks.</p>

<h2 id="clippy">Clippy</h2>

<p><a href="https://github.com/rust-lang/rust-clippy/pull/17124">#17124</a>,
<a href="https://github.com/rust-lang/rust-clippy/pull/17132">#17132</a>: In these two
PRs, <a href="https://github.com/xmakro">xmakro</a> made some huge speed-ups to Clippy.
Clippy consists of hundreds of separate lints, each of which can implement one
or more of a few dozen visitor methods: <code class="language-plaintext highlighter-rouge">check_item</code>, <code class="language-plaintext highlighter-rouge">check_stmt</code>, <code class="language-plaintext highlighter-rouge">check_expr</code>,
etc. Clippy traverses the AST and HIR and for each node it calls the
appropriate <code class="language-plaintext highlighter-rouge">check_foo</code> method for every lint on that node. Each call is a
virtual dispatch. Critically, most of these calls are no-ops because most lints
only implement a small number of <code class="language-plaintext highlighter-rouge">check_foo</code> methods (often just one). In these
PRs, xmakro found a way to combine the passes so that the empty <code class="language-plaintext highlighter-rouge">check_foo</code>
methods (i.e. the vast majority) are not called.</p>

<p>Around the same time I was investigating the exact same issue, and I came up
with a slightly different solution in
<a href="https://github.com/rust-lang/rust/pull/157762">#157762</a>. My solution was
functionally equivalent but the code changes were less elegant and more
invasive than xmakro’s. The PR didn’t merge, but I was able to get <a href="https://github.com/rust-lang/rust/pull/157762#issuecomment-4689980052">more
detailed
measurements</a>:
in most cases this reduced Clippy’s runtime by 10-30%! Branch mispredictions
were reduced by 20-80% on real-world examples and by 97% on one stress test.
The cost of virtual dispatch adds up if you do it a lot.</p>

<p>Even though I’ve been working on Rust compiler performance for ten years, this
was the first time I tried to optimize Clippy. I found a major performance
problem and fixed it, only to find someone else had beaten me to it
by a few days. I’m not sad because the better solution was merged, but I am
still surprised—what are the chances of that?</p>

<h2 id="incremental-compilation">Incremental compilation</h2>

<p>We saw a number of minor improvements to incremental compilation.</p>

<p><a href="https://github.com/rust-lang/rust/pull/153122">#153122</a>: In this PR
<a href="https://github.com/Zalathar">Zalathar</a> improved how incremental compilation
promotes disk-cached values into memory, reducing instruction counts on many
benchmarks, in the best case by 6%.</p>

<p><a href="https://github.com/rust-lang/rust/pull/153521">#153521</a>: This PR was another
tweak to incremental compilation by Zalathar, reducing instruction counts on
many benchmarks, in the best cases by more than 2%.</p>

<p><a href="https://github.com/rust-lang/rust/pull/154304">#154304</a>: In this PR
<a href="https://github.com/zetanumbers">zetanumbers</a> adjusted how the typeck query
works, for instruction count reductions across multiple benchmarks, in the best
case by 6%.</p>

<p><a href="https://github.com/rust-lang/rust/pull/157781">#157781</a>: In this PR xmakro
tweaked incremental compilation for instruction count reductions across many
benchmarks, in the best case by 5%.</p>

<p><a href="https://github.com/rust-lang/rust/pull/158794">#158794</a>: In this PR xmakro
improved dep graph read deduplication for instruction count reductions across
multiple benchmarks, in the best case by 10%.</p>

<p><a href="https://github.com/rust-lang/rust/pull/159115">#159115</a>: In this PR xmakro
again improved dep graph read deduplication for instruction count reductions
across many benchmarks, in the best case by 6%.</p>

<h2 id="new-trait-solver">New trait solver</h2>

<p>A lot of work is underway to get the <a href="https://rust-lang.github.io/rust-project-goals/2025h2/next-solver.html">new trait
solver</a>
ready for release. This includes performance work. There is a lot going on and
I’m not aware of most of it, but <a href="https://rust-lang.zulipchat.com/#narrow/channel/364551-t-types.2Ftrait-system-refactor/topic/perf.20triage/with/613396442">this Zulip
thread</a>
is a good place to read if you are interested in learning more or helping.</p>

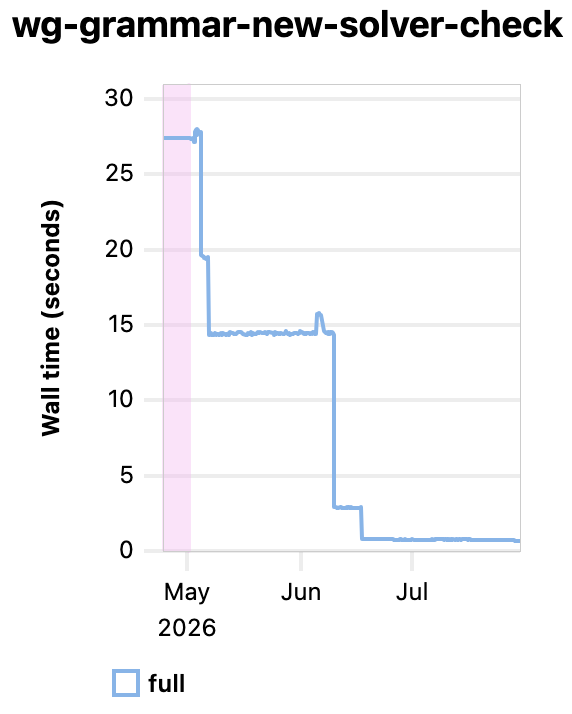
<p>The following image shows the progress on one of the new solver benchmarks.</p>

<p align="center">
  <img src="/images/2026/07/31/new-solver.png" width="300" />
</p>

<p>That’s right: the wall-time on this benchmark has dropped from 27 seconds to
less than one second over the past three months.</p>

<p><a href="https://github.com/rust-lang/rust/pull/160005">#160005</a>: I will mention this
one because it’s fun. <a href="https://github.com/lcnr/">lcnr</a> pointed at a couple of
crates where the new trait solver was causing very large slowdowns. I used
Cachegrind to profile rustc compiling them and found that almost half the time
was spent in <code class="language-plaintext highlighter-rouge">memcpy</code>! This is very unusual, but when it happens DHAT’s <a href="https://valgrind.org/docs/manual/dh-manual.html#dh-manual.copy-profiling">copy
profiling</a>
is unbelievably useful. There was a hot vector with an element type that was
136 bytes in size. LLVM uses <code class="language-plaintext highlighter-rouge">memcpy</code> (instead of generated instructions) to
move around any value with a size greater than 128 bytes. In this PR I (a)
avoided 2/3 of the moves, and (b) shrank the type down to 104 bytes so that
<code class="language-plaintext highlighter-rouge">memcpy</code> wasn’t used for the remaining moves. This reduced wall-times for the
two worst crates by 40%.</p>

<h2 id="new-contributors">New contributors</h2>

<p>There has been a welcome uptick in the amount of performance work being done
recently and I want to highlight two newcomers. The first is xmakro, who was
mentioned four times above. The second is <a href="https://github.com/bal-e">arya
dradjica</a>, the creator of
<a href="https://bal-e.org/speed/krabby/">Krabby</a>, an experimental Rust compiler
focused on speed. arya is now getting <a href="https://bal-e.org/speed/krabby/2026/rustnl-internship/">financial
support</a> to work on
both Krabby and rustc. arya’s rustc work is currently focused on macro
expansion, where she has already made a few small performance improvements
(e.g.
<a href="https://github.com/rust-lang/rust/pull/158976">#158976</a>,
<a href="https://github.com/rust-lang/rust/pull/158974">#158974</a>, and
<a href="https://github.com/rust-lang/rust/pull/158577">#158577</a>) and she has
<a href="https://github.com/rust-lang/rust/issues/159951">ideas</a> for many more. Check
out her recent <a href="https://www.youtube.com/watch?v=SWRL4JpaR2I">RustWeek talk</a> if
you want to know how much she loves optimizing things. (Spoiler: a lot.)</p>

<h2 id="llms">LLMs</h2>

<p>They’re getting a lot of attention, aren’t they? Anyway, enough about that.</p>

<h2 id="ast">AST</h2>

<p><a href="https://github.com/rust-lang/rust/pull/158942">#158942</a>: In this PR I shrank
the size of some AST nodes by removing a field. The removed data, when needed,
is now stored temporarily to the side. This gave mostly sub-1% reductions in
instruction counts.</p>

<p><a href="https://github.com/rust-lang/rust/pull/158720">#158720</a>: The previous PR paved
the way for this PR, in which I shrank the size of AST expression nodes from 72
bytes to 64 bytes. (Small enough to fit in a cache line.) Expressions are by
far the most common AST node kind, and this change reduced wall-time on a small
number of AST-heavy benchmarks, some by more than 10%. Cache miss rates on
those same benchmarks fell by as much as 29%. I remember a few years ago when
AST expression nodes were 104 bytes. Good performance often comes from chip,
chip, chipping away at things over the long term.</p>

<p><a href="https://github.com/rust-lang/rust/pull/159266">#159266</a>: In this PR I
overhauled the AST representation of attributes. It was mostly intended to be a
code cleanup, though it did result in some sub-1% reductions in instruction
counts.</p>

<h2 id="miscellaneous">Miscellaneous</h2>

<p><a href="https://github.com/rust-lang/rust/pull/155678">#155678</a>: In this PR
<a href="https://github.com/aerooneqq">aerooneqq</a> merged several HIR-level queries into
one, reducing instruction counts on many benchmarks, in the best cases by
almost 3%.</p>

<h2 id="performance-triage">Performance triage</h2>

<p>I want to recognize the people who take turns at the <a href="https://github.com/rust-lang/rustc-perf/tree/main/triage/README.md">weekly performance
triage</a>. This
involves looking at all the merged PRs from the past week that affected
performance (for both good and bad) and gathering additional information to
help isolate and fix the performance regressions. It’s an unglamorous,
semi-automated task that might seem like it could be fully automated, but I
think it’s important that humans are involved.</p>

<p>Why? Because the benchmark suite is large and complicated, the measurements
aren’t always precise, and human involvement can be persuasive. It’s one thing
for a PR author to receive a message from a bot saying “this PR caused nine
benchmarks to regress”. It’s a very different thing to receive a message from
a human with domain expertise saying “you can ignore the first four because
those benchmarks have been noisy lately; you can ignore the next three because
the regressions are so small that they are insignificant; but you should look
at the last two because they’re real and significant and might be caused by
<code class="language-plaintext highlighter-rouge">$REASON</code> and do you have ideas on how to ameliorate that?”</p>

<p>So, thank you to the current triage crew: <a href="https://github.com/mark-simulacrum">Mark
Rousskov</a>, <a href="https://github.com/JonathanBrouwer">Jonathan
Brouwer</a>, <a href="https://github.com/panstromek">Matyáš
Racek</a>, and <a href="https://github.com/kobzol">Jakub
Beránek</a>. (The 50% Czech representation is visible
via diacritics.) And thank you also to the triage alumni: <a href="https://github.com/pnkfelix">Felix
Klock</a>, <a href="https://github.com/ecstatic-morse">Dylan
MacKenzie</a>, and <a href="https://github.com/rylev">Ryan
Levick</a>.</p>

<h2 id="one-last-thing">One last thing</h2>

<p>Some personal news: I recently quit my job at VectorWare. Nothing dramatic; it
just wasn’t the right fit for me. I am now pursuing opportunities to return to
paid work on the Rust compiler. Wish me luck!</p>]]></content><author><name></name></author><summary type="html"><![CDATA[My last post on the Rust compiler’s performance was in December 2025. Let’s see what has happened since then.]]></summary></entry><entry><title type="html">How to speed up the Rust compiler in December 2025</title><link href="https://nnethercote.github.io/2025/12/05/how-to-speed-up-the-rust-compiler-in-december-2025.html" rel="alternate" type="text/html" title="How to speed up the Rust compiler in December 2025" /><published>2025-12-05T00:00:00+00:00</published><updated>2025-12-05T00:00:00+00:00</updated><id>https://nnethercote.github.io/2025/12/05/how-to-speed-up-the-rust-compiler-in-december-2025</id><content type="html" xml:base="https://nnethercote.github.io/2025/12/05/how-to-speed-up-the-rust-compiler-in-december-2025.html"><![CDATA[<p>It has been more than six months since my <a href="https://nnethercote.github.io/2025/05/22/how-to-speed-up-the-rust-compiler-in-may-2025.html">last
post</a>
on the Rust compiler’s performance. In that time I <a href="https://nnethercote.github.io/2025/07/18/looking-for-a-new-job.html">lost one
job</a> and
<a href="https://nnethercote.github.io/2025/09/16/my-new-job.html">gained another</a>. I
have less time to work directly on the Rust compiler than I used to, but I am
still doing some stuff, while also working on <a href="https://www.vectorware.com/">other interesting
things</a>.</p>

<h2 id="compiler-improvements">Compiler improvements</h2>

<p><a href="https://github.com/rust-lang/rust/pull/142095">#142095</a>: The compiler has a
data structure called <code class="language-plaintext highlighter-rouge">VecCache</code> which is a key-value store used with keys that
are densely-numbered IDs, such as <code class="language-plaintext highlighter-rouge">CrateNum</code> or <code class="language-plaintext highlighter-rouge">LocalDefId</code>. It’s a segmented
vector with increasingly large buckets added as it grows. In this PR <a href="https://github.com/joshtriplett/">Josh
Triplett</a> optimized the common case when the
key is in the first segment, which holds 4096 entries. This gave icount
reductions across many benchmark runs, beyond 4% in the best cases.</p>

<p><a href="https://github.com/rust-lang/rust/pull/148040">#148040</a>: In this PR <a href="https://github.com/saethlin">Ben
Kimock</a> added a fast path for lowering trivial
consts. This reduced compile times for the <code class="language-plaintext highlighter-rouge">libc</code> crate by 5-15%! It’s unusual
to see a change that affects a single real-world crate so much, across all
compilation scenarios: debug and release, incremental and non-incremental.
This is a great result. At the time of writing, <code class="language-plaintext highlighter-rouge">libc</code> is the #12 mostly
popular crate on crates.io as measured by “recent downloads”, and #7 as
measured by “all-time downloads”. This change also reduced icounts for a few
other benchmarks by up to 10%.</p>

<p><a href="https://github.com/rust-lang/rust/pull/147293">#147293</a>: In the query system
there was a value computed on a hot path that was only used within a <code class="language-plaintext highlighter-rouge">debug!</code>
call. In this PR I avoided doing that computation unless necessary, which gave
icount reductions across many benchmark results, more than 3% in the best case.
This was such a classic micro-optimization that I added it as an example to the
<a href="https://nnethercote.github.io/perf-book/logging-and-debugging.html">Logging and
Debugging</a>
chapter of the <a href="https://nnethercote.github.io/perf-book/">The Rust Performance
Book</a>.</p>

<p><a href="https://github.com/rust-lang/rust/pull/148706">#148706</a>: In this PR
<a href="https://github.com/dianne">dianne</a> optimized the handling of temporary scopes.
This reduced icounts on a number of benchmarks, 3% in the best case. It also
reduced peak memory usage on some of the secondary benchmarks containing very
large literals, by 5% in the best cases.</p>

<p><a href="https://github.com/rust-lang/rust/pull/143684">#143684</a>: In this PR <a href="https://github.com/nikic">Nikita
Popov</a> upgraded the LLVM version used by the compiler
to LLVM 21. In recent years every LLVM update has improved the speed of the
Rust compiler. In this case the mean icount reduction across all benchmark
results was an excellent
<a href="https://perf.rust-lang.org/compare.html?start=ec7c02612527d185c379900b613311bc1dcbf7dc&amp;end=dc0bae1db725fbba8524f195f74f680995fd549e&amp;stat=instructions%3Au&amp;nonRelevant=true">1.70%</a>,
and the mean cycle count reduction was
<a href="https://perf.rust-lang.org/compare.html?start=ec7c02612527d185c379900b613311bc1dcbf7dc&amp;end=dc0bae1db725fbba8524f195f74f680995fd549e&amp;stat=cycles%3Au&amp;nonRelevant=true">0.90%</a>,
but the mean wall-time saw an increase of
<a href="https://perf.rust-lang.org/compare.html?start=ec7c02612527d185c379900b613311bc1dcbf7dc&amp;end=dc0bae1db725fbba8524f195f74f680995fd549e&amp;stat=wall-time&amp;nonRelevant=true">0.26%</a>.
Wall-time is the true metric, because it’s what users perceive, though it has
high variance. icounts and cycles usually correlate well to wall-time,
especially on large changes like this that affect many benchmarks, though this
case is a counter-example. I’m not quite sure what to make of it; I don’t know
whether the wall-time results on the test machine are representative.</p>

<p><a href="https://github.com/rust-lang/rust/pull/148789">#148789</a>: In this PR <a href="https://github.com/m-ou-se">Mara
Bos</a> reimplemented <code class="language-plaintext highlighter-rouge">format_args!()</code> and
<code class="language-plaintext highlighter-rouge">fmt::Arguments</code> to be more space-efficient. This gave lots of small icount
wins, and a couple of enormous (30-38%) wins for the <code class="language-plaintext highlighter-rouge">large-workspace</code> stress
test. Mara wrote about this <a href="https://hachyderm.io/@Mara/115542621720999480">on
Mastodon</a>. She also has written
about prior work on formatting on <a href="https://blog.m-ou.se/format-args/">her blog</a>
and in <a href="https://github.com/rust-lang/rust/issues/99012">this tracking issue</a>.
Lots of great reading there for people who love nitty-gritty optimization
details, including nice diagrams of how data structures are laid out in memory.</p>

<h2 id="proc-macro-wins-in-bevy">Proc macro wins in Bevy</h2>

<p>In June I
<a href="https://nnethercote.github.io/2025/06/26/how-much-code-does-that-proc-macro-generate.html">added</a>
a new compiler flag <code class="language-plaintext highlighter-rouge">-Zmacro-stats</code> that measures how much code is generated by
macros. I <a href="https://nnethercote.github.io/2025/08/16/speed-wins-when-fuzzing-rust-code-with-derive-arbitrary.html">wrote
previously</a>
about how I used it to optimize <code class="language-plaintext highlighter-rouge">#[derive(Arbitrary)]</code> from the
<a href="https://crates.io/crates/arbitrary">arbitrary</a> crate used for fuzzing.</p>

<p>I also used it to streamline the code generated by <code class="language-plaintext highlighter-rouge">#[derive(Reflect)]</code> in
<a href="https://bevy.org/">Bevy</a>. This derive is used to implement reflection on many
types and it produced a <em>lot</em> of code. For example, the <code class="language-plaintext highlighter-rouge">bevy_ui</code> crate was
around 16,000 lines and 563,000 bytes of source code. The code generated by
<code class="language-plaintext highlighter-rouge">#[derive(Reflect)]</code> for types within that crate was around 27,000 lines and
1,544,000 bytes. Macro expansion almost quadrupled the size of the code, mostly
because of this one macro!</p>

<p>The code generated by <code class="language-plaintext highlighter-rouge">#[derive(Reflect)]</code> had a lot of redundancies. I made
PRs to remove unnecessary
<a href="https://github.com/bevyengine/bevy/pull/19875">calls</a>,
<a href="https://github.com/bevyengine/bevy/pull/19876">duplicate type bounds</a> (and a
<a href="https://github.com/bevyengine/bevy/pull/19922">follow-up</a>),
<a href="https://github.com/bevyengine/bevy/pull/19902"><code class="language-plaintext highlighter-rouge">const _</code> blocks</a>,
<a href="https://github.com/bevyengine/bevy/pull/19906">closures</a>,
<a href="https://github.com/bevyengine/bevy/pull/19919">arguments</a>,
<a href="https://github.com/bevyengine/bevy/pull/19929">trait bounds</a>,
<a href="https://github.com/bevyengine/bevy/pull/19930">attributes</a>,
<a href="https://github.com/bevyengine/bevy/pull/20126">impls</a>, and finally I
<a href="https://github.com/bevyengine/bevy/pull/19944">factored out some repetition</a>.</p>

<p>After doing this I measured the <code class="language-plaintext highlighter-rouge">bevy_window</code> crate. The size of the code
generated by <code class="language-plaintext highlighter-rouge">#[derive(Reflect)]</code> was reduced by 39%, which reduced <code class="language-plaintext highlighter-rouge">cargo
check</code> wall-time for that crate by 16%, and peak memory usage by 5%. And there
are likely similar improvements across many other crates within Bevy, as well
as programs that use <code class="language-plaintext highlighter-rouge">#[derive(Reflect)]</code> themselves.</p>

<p>It’s understandable that the generated code was suboptimal. Proc macros aren’t
easy to write; there was previously no easy way to measure the size of the
generated code; and the generated code was considered good enough because (a)
it worked, and (b) the compiler would effectively optimize away all the
redundancies. But in general it is more efficient to optimize away redundancies
at the generation point, where context-specific and domain-specific information
is available, rather than relying on sophisticated optimization machinery
further down the compilation pipeline that has to reconstruct information. And
it’s just less code to parse and represent in memory.</p>

<h2 id="rustdoc-json">rustdoc-json</h2>

<p>At RustWeek 2025 I had a conversation with <a href="https://github.com/obi1kenobi/">Predrag
Gruevski</a> about
<a href="https://crates.io/crates/rustdoc-json">rustdoc-json</a> (invoked with the
<code class="language-plaintext highlighter-rouge">--output-format=json</code> flag) and its effects on the performance of
<a href="https://crates.io/crates/cargo-semver-checks">cargo-semver-checks</a>. I spent
some time looking into it and found one nice win.</p>

<p><a href="https://github.com/rust-lang/rust/pull/142335">#142335</a>: In this PR I reduced
the number of allocations done by rustdoc-json. This gave wall-time reductions
of up to 10% and peak memory usage reductions of up to 8%.</p>

<p>I also tried various other things to improve rustdoc-json’s speed, without much
success. JSON is simple and easy to parse, and rustdoc-json’s schema for
representing Rust code is easy for humans to read. These features are great for
newcomers and people who want to experiment. It also means the JSON output is
space-inefficient, which limits the performance of heavy-duty tools like
cargo-semver-checks that are designed for large codebases. There are some
obvious space optimizations that could be applied to the JSON schema, like
shortening field names, omitting fields with default values, and interning
repeated strings. But these all affect its readability and flexibility.</p>

<p>The right solution here is probably to introduce a performance-oriented second
format for the heavy-duty users.
<a href="https://github.com/rust-lang/rust/pull/142642">#142642</a> is a draft attempt at
this. Hopefully progress can be made here in the future.</p>

<h2 id="faster-compilation-of-large-api-crates">Faster compilation of large API crates</h2>

<p>Josh Triplett introduced a new experimental flag, <code class="language-plaintext highlighter-rouge">-Zhint-mostly-unused</code>, which
can give big compile time wins for people using small fractions of very large
crates. This is typically the case for certain large API crates, such as
<code class="language-plaintext highlighter-rouge">windows</code>, <code class="language-plaintext highlighter-rouge">rustix</code>, and <code class="language-plaintext highlighter-rouge">aws-sdk-ec2</code>. Read about it
<a href="https://blog.rust-lang.org/inside-rust/2025/07/15/call-for-testing-hint-mostly-unused/">here</a>.</p>

<h2 id="faster-rust-builds-on-mac">Faster Rust builds on Mac</h2>

<p>Did you know that macOS has a secret setting that can make Rust builds faster?
<a href="https://nnethercote.github.io/2025/09/04/faster-rust-builds-on-mac.html">No joke!</a></p>

<h2 id="general-progress">General progress</h2>

<p>Progress since May must be split into two parts, because in July we changed the machine
on which the measurements are done.</p>

<p>The <a href="https://perf.rust-lang.org/compare.html?start=2b96ddca1272960623e41829439df8dae82d20af&amp;stat=wall-time&amp;showRawData=true&amp;tab=compile&amp;end=fdad98d7463eebcdca94716ec3036c38a8d66f50&amp;nonRelevant=true">first
period</a>
(2025-05-20 to 2025-06-30) was on the old machine.
The <a href="https://perf.rust-lang.org/compare.html?start=6988a8fea774a2a20ebebddb7dbf15dd6ef594f9&amp;stat=wall-time&amp;showRawData=true&amp;tab=compile&amp;end=83e49b75e7daf827e4390ae0ccbcb0d0e2c96493&amp;nonRelevant=true">second period</a> (2025-07-01 to 2025-12-03) was on the new machine.</p>

<p>The mean wall-time changes were moderate improvements (-3.19% and -2.65%). The
mean peak memory usage changes were a wash (+1.18% and -1.50%). The mean binary
size changes were small increases (0.45% and 2.56%).</p>

<p>It’s good that wall-times went down overall, even if the other metrics were
mixed. There is a slow but steady stream of bug fixes and new features to the
compiler, which often hurt performance. In the absence of active performance
work the natural tendency for a compiler is to get slower, so I view even small
improvements as a win.</p>

<p>The new machine reduced wall-times by about 20%. It’s worth upgrading your
hardware, if you can!</p>]]></content><author><name></name></author><summary type="html"><![CDATA[It has been more than six months since my last post on the Rust compiler’s performance. In that time I lost one job and gained another. I have less time to work directly on the Rust compiler than I used to, but I am still doing some stuff, while also working on other interesting things.]]></summary></entry><entry><title type="html">My new job</title><link href="https://nnethercote.github.io/2025/09/16/my-new-job.html" rel="alternate" type="text/html" title="My new job" /><published>2025-09-16T00:00:00+00:00</published><updated>2025-09-16T00:00:00+00:00</updated><id>https://nnethercote.github.io/2025/09/16/my-new-job</id><content type="html" xml:base="https://nnethercote.github.io/2025/09/16/my-new-job.html"><![CDATA[<p>I am happy to announce that I have joined a new startup called
<a href="https://vectorware.com/">VectorWare</a>. The linked website is currently very
bare-boned, but the company aims to use Rust to improve the state of GPU
programming.</p>

<p>This job is not a “work full-time on the Rust compiler” position like my last
one. But it will involve a lot of open source work, some Rust compiler work,
and I will continue to be a Rust compiler team member and maintainer. I will
also get to learn about GPU programming, a new area for me. Indeed, my main
accomplishment in my first week was to write Rust code that uses the GPU to
render the company logo.</p>

<p align="center">
  <img title="The VectorWare logo, which consists of twelve nested and
  overlapping triangles of different sizes. Each triangle has one red corner,
  one green corner, and one blue corner. All together the triangles form a
  stylised &quot;VW&quot;." src="/images/2025/09/16/vectorware-logo.png" width="400" />
</p>

<p>Back in July I
<a href="https://nnethercote.github.io/2025/07/18/looking-for-a-new-job.html">wrote</a>
that I was looking for a new job. There has been some
<a href="https://mp.weixin.qq.com/s/-RHfqLqeMcgHmTclY0EqqQ">public</a>
<a href="https://x.com/skydotcs/status/1961989153253675164">speculation</a> about the lack
of a follow-up post and what that meant. Was I having trouble finding a new
job? If so, what does that mean for Rust? What does it suggest for tech hiring
in general? And so on. Fortunately, this speculation was largely ill-informed,
for two reasons.</p>

<p>First, I made the decision to join VectorWare a few weeks ago, but it took some
time for the paperwork to be completed and things organised enough for a public
announcement.</p>

<p>Second, I was lucky enough to be contacted by a <em>lot</em> of people who were
interested in possibly hiring me. I won’t try to draw any conclusions from this
about finding Rust jobs in general, because I am fortunate to have an atypical
level of experience and prominence when it comes to Rust. However, it did
demonstrate that Rust is being used in an impressive range of areas.</p>

<p>Specifically, Rust is being used for: operating systems, compilers/interpreters,
wasm, GPU programming, quantum computing, databases, data analytics,
networking/cloud/server, medical, space, defence, automotive, embedded,
security software, malware detection, search, formal methods, CAD, devtools,
collaborative software, device management, real-time systems, prediction
markets, biotech, identity verification, document generation, hardware
simulation, and software modernization. (And also generative AI,
cryptocurrencies/blockchain, and algorithmic trading; I did receive a few
messages relating to these despite saying I didn’t want to work on them.) Rust
is being used by huge companies, tiny startups, and everything between.</p>

<p>This is a really encouraging sign! I knew Rust was doing well, but I didn’t
know it was doing <em>this</em> well.</p>

<p>Searching for a new job is never a fun or easy exercise, but this time it was
about as good as it gets. Many thanks to everyone who helped: those who
contacted me with interest, those who passed news of my availability along, and
those who pointed me at Rust opportunities they were aware of. I appreciate it.
I can now get to work on the new stuff and go back to pretending that LinkedIn
doesn’t exist.</p>]]></content><author><name></name></author><summary type="html"><![CDATA[I am happy to announce that I have joined a new startup called VectorWare. The linked website is currently very bare-boned, but the company aims to use Rust to improve the state of GPU programming.]]></summary></entry><entry><title type="html">Faster Rust builds on Mac</title><link href="https://nnethercote.github.io/2025/09/04/faster-rust-builds-on-mac.html" rel="alternate" type="text/html" title="Faster Rust builds on Mac" /><published>2025-09-04T00:00:00+00:00</published><updated>2025-09-04T00:00:00+00:00</updated><id>https://nnethercote.github.io/2025/09/04/faster-rust-builds-on-mac</id><content type="html" xml:base="https://nnethercote.github.io/2025/09/04/faster-rust-builds-on-mac.html"><![CDATA[<p>Did you know that macOS has a secret setting that can make Rust builds faster?
It can also make Rust tests faster (sometimes massively so). It probably even
has similar effects for other compiled languages such as C, C++, Go, and Swift.
It sounds crazy, but read on…</p>

<h2 id="the-problem">The problem</h2>

<p>Isaac Asimov reportedly said: <em>the most exciting phrase to hear in science…
is not “Eureka” but “that’s funny…”</em></p>

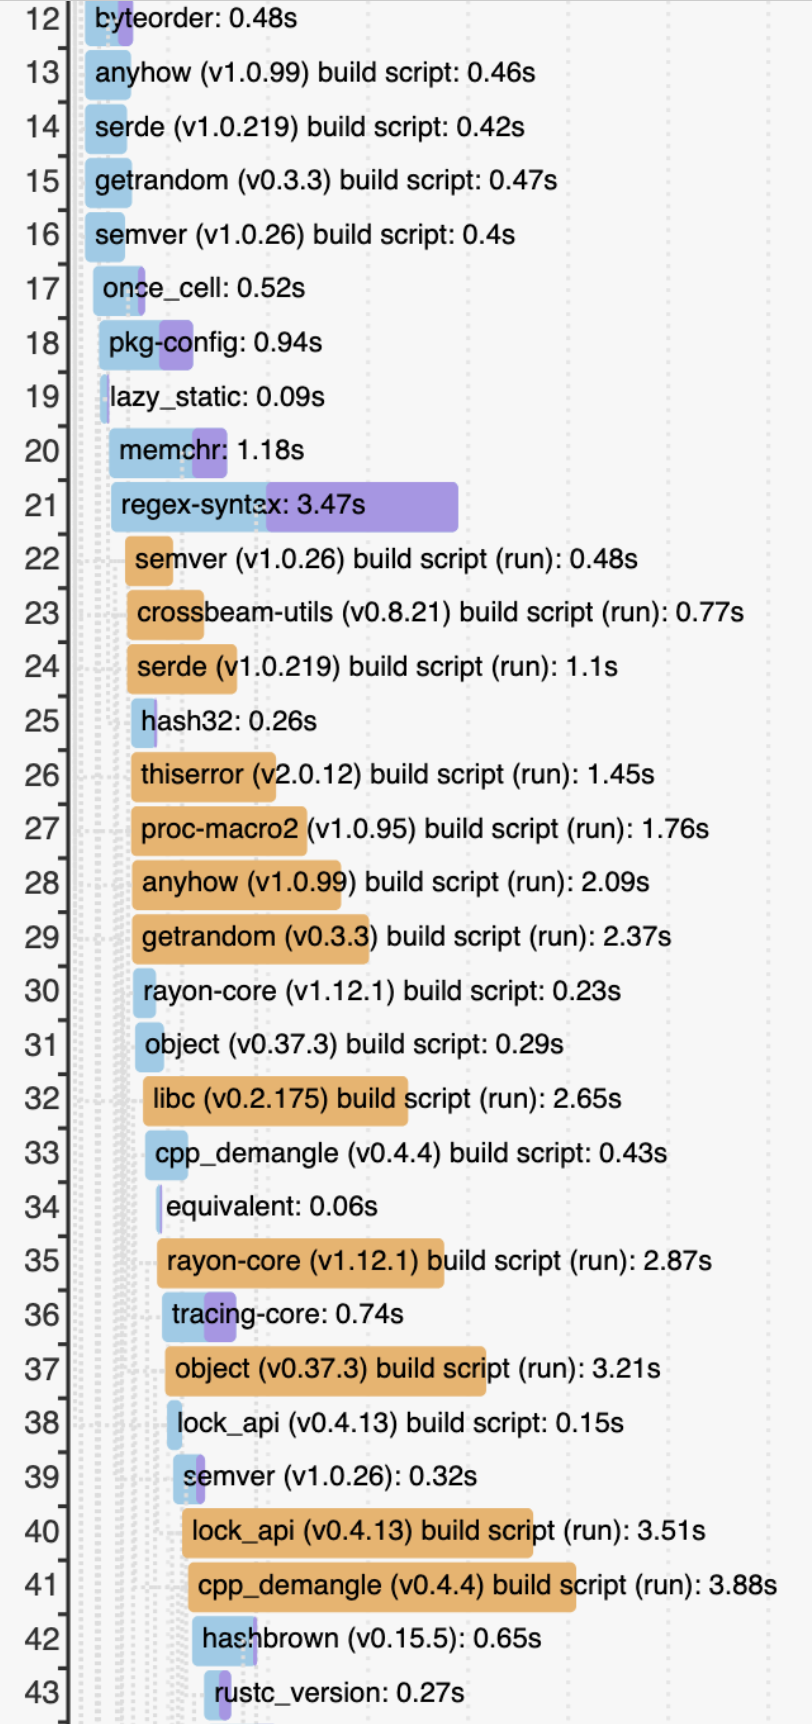
<p>I noticed something recently while looking at the output of <code class="language-plaintext highlighter-rouge">cargo build
--timings</code> on Mac: build scripts took a strangely long time to execute.
Consider the following output from compiling
<a href="https://github.com/davidlattimore/wild">wild</a> on my 2019 MacBook Pro.</p>

<p align="center">
  <img src="/images/2025/09/04/before.png" width="300" />
</p>

<p>Time is on the x-axis. Each blue/purple bar is a single invocation of the
compiler. (This image shows only part of the output. The full compilation has
over 100 crates.) Each orange bar measures the time taken to execute a build
script. The orange bars are quite long!</p>

<p><a href="https://doc.rust-lang.org/cargo/reference/build-scripts.html">Build scripts</a>
let you do custom tasks that fall outside the normal Cargo workflow. Sometimes
they are expected to be slow, such as when invoking a C compiler to build a
library. But often they are trivial. A common case is to run <code class="language-plaintext highlighter-rouge">rustc --version</code>
to see what version of the compiler is installed and then adjust some
configuration detail accordingly.</p>

<p>All the build scripts shown in this output are simple ones that should be very
quick to run, and that’s what I saw when I measured on Linux. So why were they
taking between 0.48 and 3.88 seconds on Mac? And why was each successive one
slower than the previous?</p>

<p>I tried running a couple of these build scripts directly instead of via Cargo.
They were much faster that way, e.g. 75ms vs. 300ms. Weird. At first I
suspected that Cargo was mismeasuring the build script executions somehow. I
looked at the relevant code in Cargo but it was pretty straightforward and
seemed unlikely to be hiding a problem.</p>

<h2 id="the-explanation">The explanation</h2>

<p>Before digging further I
<a href="https://rust-lang.zulipchat.com/#narrow/channel/246057-t-cargo/topic/build.20scripts.20slow.20on.20macOS.3F/near/535948902">asked</a>
on Zulip if this behaviour was familiar to anyone. <a href="https://github.com/weihanglo">Weihang
Lo</a> suggested it might be caused by code-signing
verification or some other security check.</p>

<p>Wait, what? This was not the answer I was expecting, but it was correct. macOS
has an antivirus feature called
<a href="https://support.apple.com/en-gb/guide/security/sec469d47bd8/web">XProtect</a>.</p>

<blockquote>
  <p>XProtect checks for known malicious content whenever:</p>
  <ul>
    <li>An app is first launched</li>
    <li>An app has been changed (in the file system)</li>
    <li>XProtect signatures are updated</li>
  </ul>
</blockquote>

<p>In other words, the OS scans every executable for malware on the first run.
This makes sense for executables downloaded from the internet. It’s arguably
less sensible for executables you compiled yourself. Indeed, build scripts are
the worst possible case for this kind of check, performance-wise, because each
build script executable is typically run exactly once.</p>

<p>(XProtect is closely related to another security feature called
<a href="https://support.apple.com/en-au/guide/security/sec5599b66df/web">Gatekeeper</a>.
As I understand it, Gatekeeper verifies signed code while XProtect does generic
malware scans. Note that people often use the name “Gatekeeper” when referring
to all of these activities.)</p>

<h2 id="the-workaround">The workaround</h2>

<p>You can avoid these scans by adding Terminal (or any alternative terminal app
you are using, such as iTerm) as a “developer tool” in System Settings. See
<a href="https://nexte.st/docs/installation/macos/#gatekeeper">these docs</a> for details.
Note: as the docs say, you will likely need to restart Terminal for the change
to take effect. But if you want to undo the change, you might need to reboot
the machine for the change to take effect.</p>

<p>This is the “secret setting” I mentioned at the start of this post. Searching
around, I found only a few online mentions of it.</p>
<ul>
  <li>A <a href="https://donatstudios.com/mac-terminal-run-unsigned-binaries">blog post</a>.</li>
  <li>A <a href="https://users.rust-lang.org/t/cargo-run-slow-on-macos-when-binary-already-built/117450/6">users.rust-lang.org
post</a>.</li>
  <li>A <a href="https://news.ycombinator.com/item?id=24394150">Hacker News comment</a>.</li>
  <li>The <a href="https://nexte.st/docs/installation/macos/#gatekeeper">cargo-nextest docs</a>, which cite the Hacker News comment.</li>
  <li>The <a href="https://zed.dev/docs/development/macos#speeding-up-verification">Zed docs</a>, which cite the cargo-nextest docs.</li>
  <li><a href="https://corrode.dev/blog/tips-for-faster-rust-compile-times/#macos-only-exclude-rust-compilations-from-gatekeeper">Corrode’s Tips for Faster Rust Compile
Times</a>,
which cites the cargo-nextest docs <em>and</em> the Zed docs! (This post is an
excellent and comprehensive collection of tips for speeding up Rust
compilation, by the way.)</li>
  <li>A <a href="https://rust-lang.zulipchat.com/#narrow/channel/182449-t-compiler.2Fhelp/topic/.E2.9C.94.20Is.20there.20any.20performance.20issue.20for.20MacOS.3F/near/340013849">rust-lang Zulip
thread</a>.</li>
</ul>

<p>Please note that if you do this you are disabling an OS security feature. You
should not do it unless you are comfortable with the potential speed/security
trade-off.</p>

<h2 id="the-benefits-cargo-build-cargo-check">The benefits: cargo build, cargo check</h2>

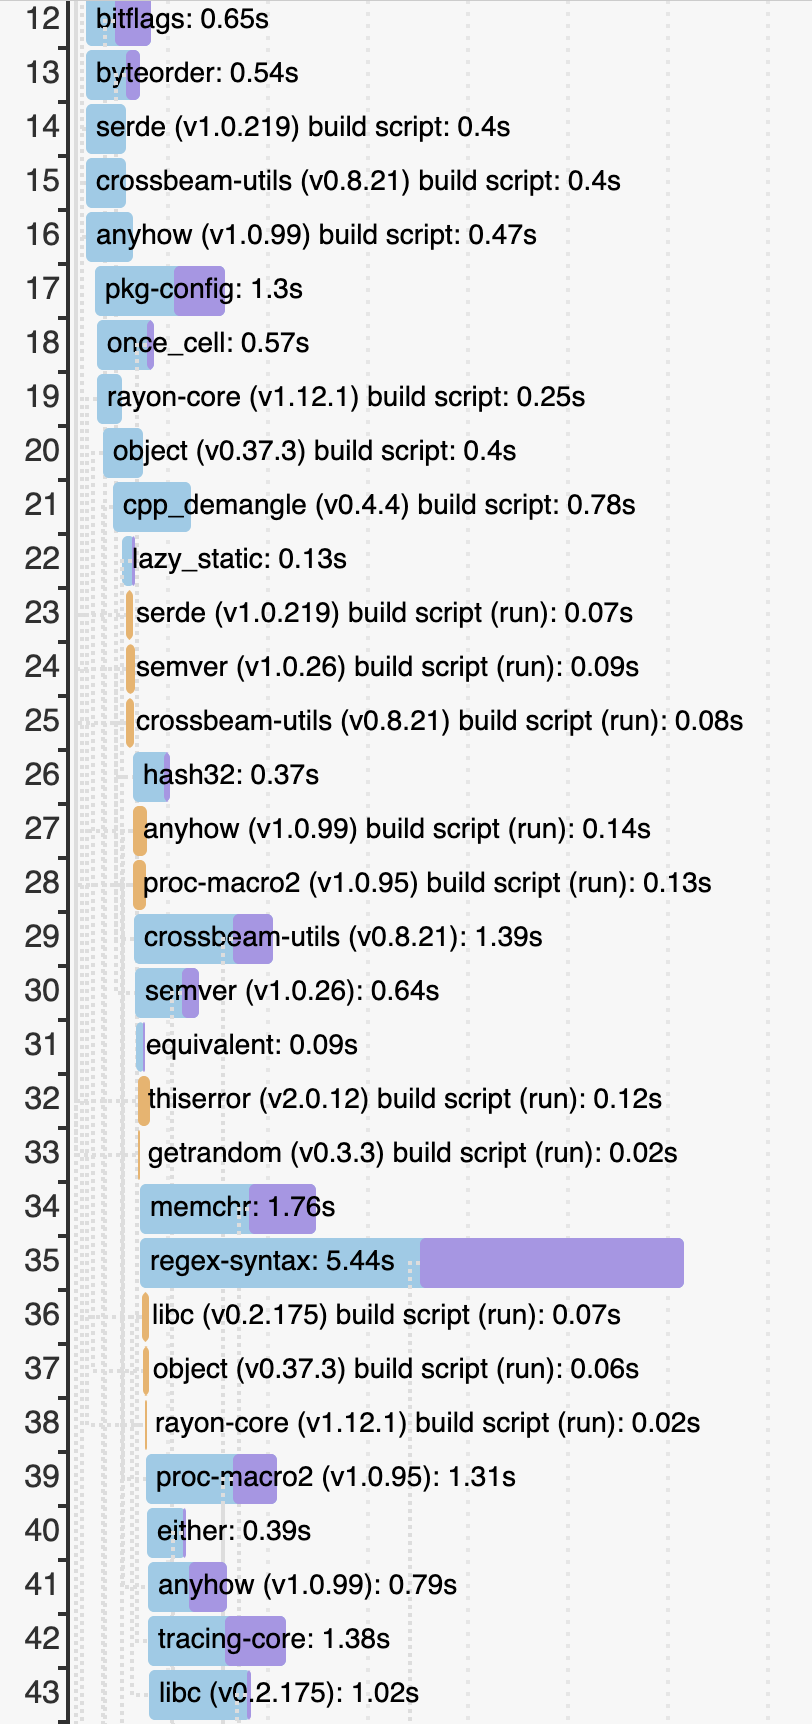
<p>The following image replicates the <code class="language-plaintext highlighter-rouge">cargo build --timings</code> partial output from
above alongside the corresponding partial output from a run with XProtect
disabled.</p>

<p align="center">
  <img src="/images/2025/09/04/before.png" width="300" />
  <img src="/images/2025/09/04/after.png" width="300" />
</p>

<p>A huge difference! Those orange bars are now tiny. The build scripts are taking
around 0.06 to 0.14 seconds each on my old MacBook Pro.</p>

<p>This definitely has the potential to speed up full builds of various Rust
projects. In this case, the original wild build took 25.9s and the new one took
25.0s. I didn’t do careful measurements to see if those numbers were
consistent. (Don’t read too much into the times taken to compile individual
crates; the scheduling between the two runs is very different.)</p>

<p>The exact effect will depend heavily on a project’s dependency
graph and the characteristics of your machine, but if build script execution is
on the critical path it will certainly have an effect.</p>

<p>Great! But maybe you don’t actually run build scripts all that often. Most of
the time you’re just rebuilding your own code, not third-party dependencies,
other than after the occasional <code class="language-plaintext highlighter-rouge">cargo clean</code>, right? Well…</p>

<h2 id="the-benefits-cargo-run">The benefits: cargo run</h2>

<p>If your project is an executable, you’ll be paying the XProtect cost every
single time you rebuild and rerun. It’s extra time on every edit-compile-run
cycle. Yuk.</p>

<h2 id="the-benefits-cargo-test">The benefits: cargo test</h2>

<p>Disabling XProtect also helps for test binaries. In fact, this is the area with
the potential for the biggest speedups, because some test setups involve many
small binaries. For example, every integration test gets its own binary. And
every pre-2024-edition doctest <a href="https://doc.rust-lang.org/edition-guide/rust-2024/rustdoc-doctests.html">gets its own
binary</a>!
And the <code class="language-plaintext highlighter-rouge">cargo-nextest</code> folks clearly noticed it.</p>

<p>The Rust compiler itself provides a particularly compelling example. Its
biggest test suite is called <code class="language-plaintext highlighter-rouge">tests/ui/</code> and involves running almost 4,000
individual executables, most of them tiny. <a href="https://github.com/madsmtm">Mads
Marquart</a> found that disabling XProtect reduced the
runtime of this test suite <a href="https://rust-lang.zulipchat.com/#narrow/channel/246057-t-cargo/topic/build.20scripts.20slow.20on.20macOS.3F/near/536314094">from 9m42s to
3m33s</a>!
Incredible.</p>

<h2 id="the-benefits-other-languages">The benefits: other languages</h2>

<p>I haven’t tested this, but developers using other compiled languages will
presumably benefit similarly, so long as development involves frequent
compilation and execution of binaries.</p>

<h2 id="spreading-the-joy">Spreading the joy</h2>

<p>The status quo is that this behaviour is documented in a few obscure places and
99%+ of Mac users are unaware. Fortunately, Mads has a <a href="https://github.com/rust-lang/cargo/pull/15908">draft
PR</a> for Cargo that detects if
XProtect is enabled and issues a warning to the user explaining its impact and
how to disable it. (There is apparently no programmatic way to disable XProtect
in the terminal and we wouldn’t want to do that anyway; the user should
be required to make an active choice.)</p>

<p>The PR is worth a look because it has a precise description of the situation,
one that goes into more detail than I have here. Also, it answers a question
posed much earlier in this post: in the original <code class="language-plaintext highlighter-rouge">cargo build --timings</code>
output, why was each successive build script slower than the previous? The PR
has the answer:</p>

<blockquote>
  <p>the XprotectService daemon runs in a single thread, so if you try to launch
10 new binaries at once, the slowdown will be more than a second.</p>
</blockquote>

<p>On my old MacBook Pro, which has eight cores, it’s much more than a second.
Going back to my original <code class="language-plaintext highlighter-rouge">cargo build --timings</code> run, the final build script
took 3.88s to run. Its execution overlapped with that of most of the previous
build scripts. Most of that 3.88s is actually spent waiting for the daemon.
Good grief.</p>

<p>There will need to be careful discussion and review of how the warning is
presented to the user, given that it’s about disabling an OS security feature.
But I am happy there is a clear path forward to get this knowledge out of “deep
lore” territory and into the purview of normal users. In the meantime, if you are
a Mac user you could consider disabling XProtect in the terminal and get the
speed benefits immediately.</p>]]></content><author><name></name></author><summary type="html"><![CDATA[Did you know that macOS has a secret setting that can make Rust builds faster? It can also make Rust tests faster (sometimes massively so). It probably even has similar effects for other compiled languages such as C, C++, Go, and Swift. It sounds crazy, but read on…]]></summary></entry><entry><title type="html">Speed wins when fuzzing Rust code with `#[derive(Arbitrary)]`</title><link href="https://nnethercote.github.io/2025/08/16/speed-wins-when-fuzzing-rust-code-with-derive-arbitrary.html" rel="alternate" type="text/html" title="Speed wins when fuzzing Rust code with `#[derive(Arbitrary)]`" /><published>2025-08-16T00:00:00+00:00</published><updated>2025-08-16T00:00:00+00:00</updated><id>https://nnethercote.github.io/2025/08/16/speed-wins-when-fuzzing-rust-code-with-derive-arbitrary</id><content type="html" xml:base="https://nnethercote.github.io/2025/08/16/speed-wins-when-fuzzing-rust-code-with-derive-arbitrary.html"><![CDATA[<p>If you are using <code class="language-plaintext highlighter-rouge">#[derive(Arbitrary)]</code> to fuzz your Rust code, update the
Arbitrary crate to v1.4.2 to get some compile time reductions and possibly some
fuzzing speed improvements.</p>

<p>You can update with the command <code class="language-plaintext highlighter-rouge">cargo update -p arbitrary -p
derive_arbitrary</code>.</p>

<h2 id="fuzzing-with-arbitrary">Fuzzing with Arbitrary</h2>

<p>The Arbitrary crate is very useful when fuzz testing Rust code. From the
<a href="https://github.com/rust-fuzz/arbitrary/blob/main/README.md">README</a>:</p>

<blockquote>
  <p>The <code class="language-plaintext highlighter-rouge">Arbitrary</code> crate lets you construct arbitrary instances of a type.</p>

  <p>This crate is primarily intended to be combined with a fuzzer like libFuzzer
and cargo-fuzz or AFL, and to help you turn the raw, untyped byte buffers that
they produce into well-typed, valid, structured values. This allows you to
combine structure-aware test case generation with coverage-guided,
mutation-based fuzzers.</p>
</blockquote>

<p>In other words, it defines a trait <code class="language-plaintext highlighter-rouge">Arbitrary</code> that can be used to convert a
stream of randomized bytes into valid values. Like many good Rust libraries it
uses proc macros to make user’s lives easy: you can just stick
<code class="language-plaintext highlighter-rouge">#[derive(Arbitrary)]</code> on a type and it will automatically generate the
conversion code for you.</p>

<h2 id="code-size">Code size</h2>

<p>I was recently using the Rust compiler’s new
<a href="https://nnethercote.github.io/2025/06/26/how-much-code-does-that-proc-macro-generate.html"><code class="language-plaintext highlighter-rouge">-Zmacro-stats</code></a>
option on a project that used <code class="language-plaintext highlighter-rouge">#[derive(Arbitrary)]</code> and saw that the proc
macro was generating a lot of code. Even for a simple struct like <code class="language-plaintext highlighter-rouge">struct
S(u32, u32)</code> it would generate more than 100 lines of code. In a large project
containing many types marked with <code class="language-plaintext highlighter-rouge">#[derive(Arbitrary)]</code>, that much code can
add up and cause a lot of work for the compiler.</p>

<p>I used <code class="language-plaintext highlighter-rouge">cargo expand</code> to inspect the generated code. Annoyingly, only a
fraction of it code was doing the actual conversion of random bytes to valid
values. The rest involved a per-type counter that protects against an <a href="https://github.com/rust-fuzz/arbitrary/issues/107">edge
case</a> that can cause
infinite recursion on recursive types.</p>

<h2 id="improvements">Improvements</h2>

<p>I made three small improvements.</p>

<p><a href="https://github.com/rust-fuzz/arbitrary/pull/227">#227</a>: In this PR I marked
the per-type counter as <code class="language-plaintext highlighter-rouge">const</code>, which enables a more efficient thread local
implementation that can avoid lazy initialization and does not need to track
any additional state.</p>

<p><a href="https://github.com/rust-fuzz/arbitrary/pull/228">#228</a>: The per-type counter
was generated for every type marked with <code class="language-plaintext highlighter-rouge">#[derive(Arbitrary)]</code>, even ones that
aren’t recursive. Why? It’s surprisingly hard for a proc macro to tell if a
type is recursive. Proc macros work entirely at the syntactic level, without
access to type information. At that level, any field might lead to type
recursion. (Even builtin types like <code class="language-plaintext highlighter-rouge">u32</code>? Yes, because it’s possible to define
your own type called <code class="language-plaintext highlighter-rouge">u32</code>. Sigh.) However, there is one family of types that
can never be recursive: fieldless enums like <code class="language-plaintext highlighter-rouge">enum { A, B }</code>. In this PR I
removed the per-type counter and the corresponding code for all such types. For
an artificial stress test containing 1,000 fieldless enums, this change reduced
compile times by 75%.</p>

<p><a href="https://github.com/rust-fuzz/arbitrary/pull/229">#229</a>: The code updating the
per-type counter was somewhat repetitive. In this PR I factored out the
repetitiveness, in a way that shouldn’t affect runtime speed. For another
artificial stress test containing 1,000 simple structs, the change reduced
compile times by 30-40%.</p>

<p>On a real-world project using Arbitrary these changes reduced incremental
rebuilds from 4.0s to 3.8s, a ~5% reduction. It’s possible that the changes
might also increase fuzzing speed, though I haven’t measured that and any
effect is probably small.</p>

<h2 id="you-should-update-like-now">You should update, like, now</h2>

<p>These are not enormous wins, but hey, updating Rust crates is really easy. You
should update <code class="language-plaintext highlighter-rouge">arbitrary</code> and <code class="language-plaintext highlighter-rouge">derive_arbitrary</code> to <a href="https://github.com/rust-fuzz/arbitrary/blob/main/CHANGELOG.md#142">version
1.4.2</a>,
right now. Check <code class="language-plaintext highlighter-rouge">Cargo.lock</code> to make sure you did it right.</p>

<p>Happy fuzzing!</p>]]></content><author><name></name></author><summary type="html"><![CDATA[If you are using #[derive(Arbitrary)] to fuzz your Rust code, update the Arbitrary crate to v1.4.2 to get some compile time reductions and possibly some fuzzing speed improvements.]]></summary></entry><entry><title type="html">I am a Rust compiler engineer looking for a new job</title><link href="https://nnethercote.github.io/2025/07/18/looking-for-a-new-job.html" rel="alternate" type="text/html" title="I am a Rust compiler engineer looking for a new job" /><published>2025-07-18T00:00:00+00:00</published><updated>2025-07-18T00:00:00+00:00</updated><id>https://nnethercote.github.io/2025/07/18/looking-for-a-new-job</id><content type="html" xml:base="https://nnethercote.github.io/2025/07/18/looking-for-a-new-job.html"><![CDATA[<p><strong>UPDATE 2025-09-03: I have found a new job and will be starting next week. I
will post more details soon. Many thanks to everyone who helped publicize this
post and to everyone who contacted me about possible work. Rust is being used
in many interesting places!</strong></p>

<p>For the past 3.75 years I have been fortunate to work on Futurewei’s Rust team,
where I had enormous freedom to “make Rust better” however I see fit. It has
been the highlight of my career and I am grateful to Sid Askary and other
Futurewei folks that helped make it happen.</p>

<p>Unfortunately, this job is going away soon; the team is being shrunk due to
budget cuts. I don’t have insight into the detailed reasoning, but I suspect it
mostly comes down to two things: (a) international politics and economics are
in upheaval, and (b) AI is sucking up a lot of money and attention in the tech
world, leaving less for everything else.</p>

<p>I would love to find a position that lets me continue to work on Rust in this
fashion. Rust is an incredible project and technology. It needs and deserves to
have people who are paid full-time to maintain it, and I believe I am a good
person to do this.</p>

<h2 id="some-numbers">Some numbers</h2>

<p>It’s hard to quantify impact, but let’s give it a try. All numbers are correct
at the time of writing.</p>

<p>First, let’s start with commits to the <a href="https://github.com/rust-lang/rust/">rust-lang/rust
repository</a>.</p>
<ul>
  <li><code class="language-plaintext highlighter-rouge">git log</code> says I have made 3,375 commits.</li>
  <li>560 were from 2016-2020, during my time at Mozilla, where I found ways to
contribute to Rust part-time despite not being on the Rust team.</li>
  <li>2,815 were since I joined the Futurewei team in late 2021.</li>
  <li>This puts me at #16 on the <a href="https://github.com/rust-lang/rust/graphs/contributors">all-time contributors
list</a>, which goes back
to 2010. It’s #14 if you exclude the #1 and #2 entries which are for a bot
and a person that do a large number of merge commits.</li>
  <li>The contributors list includes people who haven’t been active for years. If
we restrict it to the last two I am at #6, or #4 after excluding merge commits.
(This time window can be selected via a drop-down menu at the top right of
the <a href="https://github.com/rust-lang/rust/graphs/contributors">contributors
list</a>, though it
doesn’t produce a usable link.)</li>
</ul>

<p>Next, let’s expand consideration to <a href="https://docs.github.com/en/account-and-profile/setting-up-and-managing-your-github-profile/managing-contribution-settings-on-your-profile/viewing-contributions-on-your-profile">GitHub
contributions</a>,
which includes (non-merge?) commits and also things like issue creation,
reviews, and discussions.</p>
<ul>
  <li>I am currently the #16 contributor, with <a href="https://thanks.rust-lang.org/rust/all-time/">4013
contributions</a>, or #15 if we exclude
<a href="https://github.com/bors">@bors</a> the bot.</li>
  <li>I don’t know where I ranked when I started at Futurewei, but I would estimate
slightly outside the top 100.</li>
  <li>My contribution rate has ticked up over time, and I have been in the top five
human contributors to several Rust releases.</li>
</ul>

<p>Commits and contributions are imperfect measures of impact, for sure. But when
the numbers get high enough, I think they provide a decent signal. The other
names at the top of these lists are all highly valuable and prolific project
members.</p>

<h2 id="areas-of-expertise">Areas of expertise</h2>

<p>I was a “compiler contributor” for a long time, which was the designation used
for the second tier of contributors, in comparison to the first tier in the
“compiler team”.</p>

<p>Last year things were reorganised and I am now a <a href="https://forge.rust-lang.org/compiler/membership.html?highlight=maintainer#compiler-team-member">“compiler team
member”</a>
(“someone who contributes regularly”) and also a
<a href="https://forge.rust-lang.org/compiler/membership.html?highlight=maintainer#maintainers">“maintainer”</a>
(“not only a regular contributor, but are actively helping to shape the
direction of the team or some part of the compiler (or multiple parts)”)</p>

<p>I am a member of the primary reviewers group.</p>

<p>I am also a member of the <a href="https://www.rust-lang.org/governance/teams/compiler#team-wg-compiler-performance">compiler performance working
area</a>
and the <a href="https://www.rust-lang.org/governance/teams/compiler#team-wg-parallel-rustc">parallel rustc working
area</a>.</p>

<p>In terms of the compiler codebase:</p>
<ul>
  <li>The compiler is over 700,000 lines of code, in the <code class="language-plaintext highlighter-rouge">compiler/</code> directory of
the Rust repository.</li>
  <li>I have laid eyes on almost every file in <code class="language-plaintext highlighter-rouge">compiler/</code>.</li>
  <li>I have committed changes to 75 of the 77 crates in <code class="language-plaintext highlighter-rouge">compiler/</code>.</li>
</ul>

<p>Some compiler areas where I have particular depth of expertise include the
following.</p>
<ul>
  <li>Compiler performance, profiling and benchmarking</li>
  <li>Lexing and parsing</li>
  <li>Token/AST representation and processing, including macro expansion</li>
  <li>Builtin macro code generation</li>
  <li>Compiler error generation</li>
  <li>Dataflow analysis structure</li>
  <li>CGU splitting</li>
</ul>

<p>I have also made major contributions to
<a href="https://github.com/rust-lang/rustc-perf/">rustc-perf</a>, smaller contributions
to rustdoc, clippy, rustfmt, and cargo, and a handful of contributions to
external projects like <a href="https://github.com/dtolnay/quote">quote</a>,
<a href="https://github.com/bevyengine/bevy">Bevy</a>,
<a href="https://github.com/rust-fuzz/cargo-fuzz">cargo-fuzz</a>,
<a href="https://github.com/dtolnay/cargo-llvm-lines">cargo-llvm-lines</a>, <a href="https://lukaswirth.dev/tlborm/">The Little
Book of Rust Macros</a>,
<a href="https://github.com/Gankra/thin-vec">thin-vec</a>,
<a href="https://github.com/servo/rust-smallvec">rust-smallvec</a>, and
<a href="https://github.com/immunant/c2rust/">c2rust</a>.</p>

<h2 id="specific-contributions">Specific contributions</h2>

<p>In the Rust community I’m best known for working on compiler performance, and
in the past 3.75 years I’ve done a lot of work there. Some highlights:</p>
<ul>
  <li>I oversaw the <a href="https://hackmd.io/YJQSj_nLSZWl2sbI84R1qA">compiler performance roadmap in
2022</a>.</li>
  <li>I <a href="https://hackmd.io/mxdn4U58Su-UQXwzOHpHag?view">analyzed</a> the compiler’s
performance on the most popular 1000 crates, and made a number of speedups as
a result.</li>
  <li>I <a href="https://nnethercote.github.io/2022/04/12/how-to-speed-up-the-rust-compiler-in-april-2022.html">overhauled declarative macro
expansion</a>,
giving big speed wins and also making the code simpler and more maintainable.</li>
  <li>I <a href="https://nnethercote.github.io/2022/07/20/how-to-speed-up-the-rust-compiler-in-july-2022.html">optimized the code generated for <code class="language-plaintext highlighter-rouge">derive</code>d traits such as
<code class="language-plaintext highlighter-rouge">Debug</code></a>, reducing compile times.</li>
  <li>I implemented a new flag <a href="https://nnethercote.github.io/2025/06/26/how-much-code-does-that-proc-macro-generate.html">-Zmacro-stats</a>
to measure proc macro code size and then <a href="https://github.com/bevyengine/bevy/issues/19873">shrank the size of Bevy’s
<code class="language-plaintext highlighter-rouge">#[derive(Reflect)]</code> code</a>.
This reduced the <code class="language-plaintext highlighter-rouge">cargo check</code> time for the <code class="language-plaintext highlighter-rouge">bevy_ui</code> crate by 16%.</li>
  <li>I helped with the rustc-perf benchmark suite updates in
<a href="https://hackmd.io/d9uE7qgtTWKDLivy0uoVQw">2022</a> and
<a href="https://github.com/rust-lang/rustc-perf/issues/2024">2025</a>.</li>
  <li>I <a href="https://nnethercote.github.io/2023/05/03/valgrind-3.21-is-out.html">overhauled Cachegrind’s annotation
tools</a> to
make them more useful for profiling the Rust compiler and other complex
programs.</li>
  <li>I continued writing my long-running <a href="https://nnethercote.github.io/2025/05/22/how-to-speed-up-the-rust-compiler-in-may-2025.html">“How to speed up the Rust
compiler”</a>
blog series, with another dozen posts.</li>
  <li>There are far too many individual PRs to mention, but three of my favourites
were: <a href="https://github.com/rust-lang/rust/pull/93984"><code class="language-plaintext highlighter-rouge">ChunkedBitSet</code></a> and the
removal of <a href="https://github.com/rust-lang/rust/pull/133431"><code class="language-plaintext highlighter-rouge">HybridBitSet</code></a>;
<a href="https://github.com/rust-lang/rust/pull/97345">deep `fast_reject</a> (with
<a href="https://github.com/lcnr">@lcnr</a>); and a <a href="https://github.com/rust-lang/rust/pull/141421">surprisingly massive rustdoc
speedup</a>.</li>
</ul>

<p>I also branched out and did a lot of non-performance work. A lot of this can be
classified as “maintainability” or “cleanup” or “refactoring” or “tech debt
removal”. I have a knack for it and in a codebase as large and old as the Rust
compiler it is always valuable. Some examples:</p>
<ul>
  <li>
    <p>I overhauled the internal APIs for generating compiler errors, which are used
all over the compiler and were a mess, via 30+ PRs and hundreds of commits.
My favourite review comment was <a href="https://github.com/rust-lang/rust/pull/119606#issuecomment-1880642866">this
one</a>:</p>

    <blockquote>
      <p>Thanks for finally making <code class="language-plaintext highlighter-rouge">emit</code> consume. You broke the “add 1 to this counter
if you tried” situation.</p>
    </blockquote>

    <p>I.e. I fixed a problem that multiple other people had previously tried and
failed to fix. It only took a PR with 14 commits that touched 112 files.</p>
  </li>
  <li>I greatly <a href="https://nnethercote.github.io/2024/12/19/streamlined-dataflow-analysis-code-in-rustc.html">simplified the structure of the dataflow analysis
passes</a>.</li>
  <li>I <a href="https://github.com/rust-lang/rust/pull/124141">removed an awful internal design detail whereby AST nodes could be
embedded in tokens</a>. I
completed this three years after I first tried, on the third attempt, after a
great number of preliminary cleanups.</li>
  <li>I removed <a href="https://github.com/rust-lang/rust/pull/101841">save-analysis</a> and
<a href="https://github.com/rust-lang/rust/pull/116412">compiler plugins</a>, two
compiler features that had been deprecated for years but needed someone to
push through their removal. These removals then enabled various subsequent
simplifications.</li>
  <li>I overhauled and simplified how <a href="https://nnethercote.github.io/2023/07/11/back-end-parallelism-in-the-rust-compiler.html">codegen unit splitting
works</a>
in the compiler backend.</li>
  <li>I <a href="https://github.com/rust-lang/rust/pull/125443">turned on <code class="language-plaintext highlighter-rouge">use</code> item formatting within the
compiler</a>, a surprisingly
controversial change. The PR modified 1,867 files, which is my biggest single
PR. I am very happy to no longer have to think how to format <code class="language-plaintext highlighter-rouge">use</code> items.</li>
  <li>I simplified compiler/rustdoc startup in a few ways, e.g.
one example is <a href="https://github.com/rust-lang/rust/pull/102769">here</a>.</li>
  <li>I <a href="https://github.com/rust-lang/compiler-team/issues/831">fixed a ton of inconsistencies in operator representation in 
tokens and the
AST</a>.</li>
  <li>I <a href="https://github.com/rust-lang/rust/issues/137978">fixed a lot of places where the empty symbol was misleading used to mean
“no symbol”</a>, fixing some
bugs along the way. (This is Rust, not C, we have the <code class="language-plaintext highlighter-rouge">Option</code> type.)</li>
  <li>I <a href="https://github.com/rust-lang/rust/pull/141603">got rid of the ancient <code class="language-plaintext highlighter-rouge">P</code> type in the
AST</a>. It was a smart pointer
type that predated Rust 1.0, and I replaced it with <code class="language-plaintext highlighter-rouge">Box</code>.</li>
</ul>

<p>If I run the following command that summarizes my changes on the repository:</p>
<div class="language-plaintext highlighter-rouge"><div class="highlight"><pre class="highlight"><code>git log --author="Nicholas Nethercote" -p | diffstat
</code></pre></div></div>
<p>the output is this:</p>
<div class="language-plaintext highlighter-rouge"><div class="highlight"><pre class="highlight"><code>8759 files changed, 145338 insertions(+), 152183 deletions(-)
</code></pre></div></div>
<p><a href="https://www.folklore.org/Negative_2000_Lines_Of_Code.html">Negative lines of
code!</a> Nice.
Fittingly, by far the most common first word in my commit messages is “Remove”,
used on 752 of 3,375 commits.</p>

<h2 id="other-activities">Other activities</h2>

<p>Most of my work is around code, but I have also done some other things over the
past 3.75 years.</p>
<ul>
  <li>I gave talks at <a href="https://www.youtube.com/watch?v=q2vJ8Faundw">RustNL 2023</a>,
<a href="https://www.youtube.com/watch?v=gcd2Lqd4Ln0&amp;list=PLx2fLm_Sb4FGJNZHrG4nv0le-Ouu1O18I">GOSIM
2023</a>,
and <a href="https://www.youtube.com/watch?v=8E7I0EGRXo0">GOSIM 2024</a>.</li>
  <li>I attended RustConf 2022 and RustWeek 2025 and the co-located unconferences
for project members. RustWeek 2025 was especially good, I met and reconnected
with a lot of people and I returned home feeling newly energized. (Which
makes my losing my job shortly afterward all the more disappointing.)</li>
  <li>I have done a small amount of Rust performance consulting work for ISRG and
OpenAI.</li>
  <li>I maintained <a href="https://nnethercote.github.io/perf-book/">The Rust Performance
Book</a>.</li>
  <li>I did all this while working 100% remotely in Melbourne, Australia, something
I’ve done since 2009, sometimes as a contractor, sometimes as an employee.</li>
</ul>

<h2 id="on-the-job-market">On the job market</h2>

<p>In short: I do a lot of work on Rust. I think it’s valuable. I’d love to be
able to keep doing it. If you know of any way that could happen, please get in
touch.</p>

<p>I have worked in the industry for almost twenty years. I have worked for
Mozilla and Apple. I have a <a href="https://nnethercote.github.io/pubs/phd2004.pdf">PhD in
Valgrind</a> and other
<a href="https://nnethercote.github.io/pubs.html">publications</a>. I co-won the <a href="https://www.sigplan.org/Awards/PLDI/">Most
Influential PLDI Paper Award</a> in 2017.</p>

<p>If I can’t find a job that involves me working on Rust, I would like to find a
job that uses Rust for interesting ends, preferably in ways that are open
source.</p>

<p>I am <strong>not</strong> interested in any of the following:</p>
<ul>
  <li>blockchain/cryptocurrencies</li>
  <li>generative AI</li>
  <li>algorithmic trading</li>
  <li>relocating from Melbourne</li>
</ul>

<p>My contact details and other basic information is
<a href="https://nnethercote.github.io/about-me.html">here</a>. My LinkedIn profile is
<a href="https://www.linkedin.com/in/nnethercote/">here</a>. Thank you for reading this
far!</p>]]></content><author><name></name></author><summary type="html"><![CDATA[UPDATE 2025-09-03: I have found a new job and will be starting next week. I will post more details soon. Many thanks to everyone who helped publicize this post and to everyone who contacted me about possible work. Rust is being used in many interesting places!]]></summary></entry><entry><title type="html">How much code does that proc macro generate?</title><link href="https://nnethercote.github.io/2025/06/26/how-much-code-does-that-proc-macro-generate.html" rel="alternate" type="text/html" title="How much code does that proc macro generate?" /><published>2025-06-26T00:00:00+00:00</published><updated>2025-06-26T00:00:00+00:00</updated><id>https://nnethercote.github.io/2025/06/26/how-much-code-does-that-proc-macro-generate</id><content type="html" xml:base="https://nnethercote.github.io/2025/06/26/how-much-code-does-that-proc-macro-generate.html"><![CDATA[<p>Rust’s <a href="https://doc.rust-lang.org/reference/procedural-macros.html">proc
macros</a> are
powerful but tricky, and have some compile-time costs. This post is about a new
tool to help quantify and reduce some of those costs.</p>

<p align="center">
  <img alt="Meme image of Homer Simpson toasting a crowed with a glass of beer. The
  caption says: To macros! The cause of, and solution to, all of Rust's problems." src="/images/2025/06/26/to-macros.jpg" width="500" />
</p>

<h2 id="proc-macro-costs">Proc macro costs</h2>

<p>There are several ways proc macros affect compile times.</p>
<ol>
  <li>The time to compile the proc macro crate itself.</li>
  <li>The time to compile all crates that the proc macro crate depends on, often
including <a href="https://crates.io/crates/proc-macro2"><code class="language-plaintext highlighter-rouge">proc-macro2</code></a>,
<a href="https://crates.io/crates/syn"><code class="language-plaintext highlighter-rouge">syn</code></a> and
<a href="https://crates.io/crates/quote"><code class="language-plaintext highlighter-rouge">quote</code></a>.</li>
  <li>The time to run the proc macro invocations.</li>
  <li>The time to compile the code generated by the proc macro invocations.</li>
</ol>

<p>For costs 1 and 2, “compile” means full compilation including code generation,
even when you are running <code class="language-plaintext highlighter-rouge">cargo check</code>. This is one reason why <code class="language-plaintext highlighter-rouge">cargo check</code>
output includes a mix of “Checking” and “Compiling” lines. (The other reason for
“Compiling” lines is crates with build scripts, and crates that build scripts
depend on.)</p>

<p><a href="https://github.com/dtolnay/watt">watt</a> is an approach to avoid costs 1 and 2.
This is reasonable, but those costs usually occur only on clean builds. Costs 3
and 4 will occur on clean builds and also on many rebuilds. I am particularly
interested in cost 4, because I think it might be underappreciated. That is
what this post is about.</p>

<p>Proc macros are trivial to invoke, but it’s harder to know how much code they
generate. You can use <a href="https://github.com/dtolnay/cargo-expand">cargo-expand</a>
to inspect the code after macro expansion has finished. This can be useful, but
lots of people don’t know about it, and it doesn’t scale in a large codebase.</p>

<p>For example, I recently looked at a large project that had around 100,000 lines
of code and used proc macros heavily. After macro expansion, the code size more
than tripled! Once the project authors knew about this they were able to
eliminate some proc macros that weren’t important, and replace some heavyweight
ones with lightweight ones. After these small changes their compile times
dropped by around 20%.</p>

<h2 id="a-new-tool-to-help">A new tool to help</h2>

<p>I recently <a href="https://github.com/rust-lang/rust/pull/142934">implemented</a> a new
unstable flag for the Rust compiler, <code class="language-plaintext highlighter-rouge">-Zmacro-stats</code>, that can help shine a lot
on proc macro code size. It is available in Nightly, and there are two basic
ways to use it.</p>

<p>If you just want to know about a leaf crate of your project, you can run a
command like this:</p>
<div class="language-plaintext highlighter-rouge"><div class="highlight"><pre class="highlight"><code>cargo +nightly rustc -- -Zmacro-stats
</code></pre></div></div>
<p>and it will print information about the amount of code generated by both proc
macros and declarative macros, though the former are usually more notable.</p>

<p>Or, if you want to know about multiple crates of your project, you can run a
command like this:</p>
<div class="language-plaintext highlighter-rouge"><div class="highlight"><pre class="highlight"><code>RUSTFLAGS="-Zmacro-stats" cargo +nightly build
</code></pre></div></div>
<p>What does the output look like? Consider this very simple Rust program called
<code class="language-plaintext highlighter-rouge">measure_proc_macros</code>:</p>
<div class="language-plaintext highlighter-rouge"><div class="highlight"><pre class="highlight"><code>fn main() {
    println!("yellow bird");
}

#[test]
fn my_test() {
    assert_eq!(1 + 1, 2);
}
</code></pre></div></div>
<p>Here’s the <code class="language-plaintext highlighter-rouge">-Zmacro-stats</code> output, which is printed on <code class="language-plaintext highlighter-rouge">stderr</code>:</p>
<div class="language-plaintext highlighter-rouge"><div class="highlight"><pre class="highlight"><code>===============================================================================
MACRO EXPANSION STATS: measure_proc_macros
Macro Name                         Uses    Lines  Avg Lines    Bytes  Avg Bytes
-------------------------------------------------------------------------------
println!                              1        1        1.0       63       63.0
::std::format_args_nl!                1        1        1.0       29       29.0
#[test]                               1        1        1.0        0        0.0
===============================================================================
</code></pre></div></div>
<p>First, we can see that the <code class="language-plaintext highlighter-rouge">println!</code> had one use, and it produced one line of
code, which was 63 bytes of text. The byte count is the ultimate measure, but
lines of code are also included because that’s a code size measurement that
programmers are more used to. The line count is made on code as formatted by
the compiler’s internal pretty printer, so it won’t be affected by the
formatting of any of the hand-written code.</p>

<p>Next, we can also see an entry for <code class="language-plaintext highlighter-rouge">::std::format_args_nl!</code>. Where did that
come from? Well, the <code class="language-plaintext highlighter-rouge">println!</code> call
<a href="https://github.com/rust-lang/rust/blob/bc4376fa73b636eb6f2c7d48b1f731d70f022c4b/library/std/src/macros.rs#L143">expands</a>
to code that includes a call to <code class="language-plaintext highlighter-rouge">::std::format_args_nl!</code>, which then gets
expanded.</p>

<p>Finally, we see that the <code class="language-plaintext highlighter-rouge">#[test]</code> produced zero code. This makes sense,
because tests are omitted for normal builds. (I also tried <code class="language-plaintext highlighter-rouge">-Zmacro-stats</code> with
<code class="language-plaintext highlighter-rouge">cargo test</code> and saw that the <code class="language-plaintext highlighter-rouge">#[test]</code> invocation generated 24 lines and 802
bytes of code.)</p>

<p>What about proc macros? Let’s try out some derive proc macros by adding this code:</p>
<div class="language-plaintext highlighter-rouge"><div class="highlight"><pre class="highlight"><code>#[derive(Clone, Copy, Debug, Default, PartialEq, Eq, PartialOrd, Ord, Hash)] 
#[derive(derive_more::From, derive_more::Add, derive_more::Constructor)] 
#[derive(serde::Serialize, serde::Deserialize)] 
#[derive(arbitrary::Arbitrary)] 
struct Point { x: i32, y: i32 }
</code></pre></div></div>
<p>This is a very simple struct with many derives:</p>
<ul>
  <li>all the builtin derives;</li>
  <li>several builtin-like derives from
<a href="https://crates.io/crates/derive_more">derive_more</a>;</li>
  <li>serialization and deserialization derives from
<a href="https://crates.io/crates/serde">serde</a>;</li>
  <li><code class="language-plaintext highlighter-rouge">Arbitrary</code> from <a href="https://crates.io/crates/arbitrary">arbitrary</a>, which is
used for fuzzing.</li>
</ul>

<p><code class="language-plaintext highlighter-rouge">-Zmacro-stats</code> produces this additional output:</p>
<div class="language-plaintext highlighter-rouge"><div class="highlight"><pre class="highlight"><code>===============================================================================
MACRO EXPANSION STATS: measure_proc_macros
Macro Name                         Uses    Lines  Avg Lines    Bytes  Avg Bytes
-------------------------------------------------------------------------------
#[derive(serde::Deserialize)]         1      159      159.0    8_622    8_622.0
#[derive(arbitrary::Arbitrary)]       1       81       81.0    3_679    3_679.0
::std::thread::local_impl::thread_local_inner!
                                      2       34       17.0    1_499      749.5
#[derive(serde::Serialize)]           1       23       23.0    1_002    1_002.0
#[derive(PartialOrd)]                 1       12       12.0      440      440.0
#[derive(Ord)]                        1       11       11.0      333      333.0
#[derive(Debug)]                      1        8        8.0      269      269.0
#[derive(PartialEq)]                  1        9        9.0      255      255.0
#[derive(Hash)]                       1        8        8.0      252      252.0
#[derive(Default)]                    1       10       10.0      246      246.0
#[derive(derive_more::Add)]           1        9        9.0      237      237.0
#[derive(Eq)]                         1        9        9.0      219      219.0
#[derive(derive_more::From)]          1        6        6.0      205      205.0
::std::thread_local!                  2        5        2.5      198       99.0
#[derive(Clone)]                      1        8        8.0      184      184.0
#[derive(derive_more::Constructor)]   1        7        7.0      174      174.0
#[derive(Copy)]                       1        2        2.0       64       64.0
===============================================================================
</code></pre></div></div>
<p>What have we learned?</p>
<ul>
  <li>The builtin macros generate small amounts of code, between 2 and 12 lines.</li>
  <li>The <code class="language-plaintext highlighter-rouge">derive_more</code> macros are similar. (I tried all of the derives available
in that crate, and they all gave similar results.)</li>
  <li><code class="language-plaintext highlighter-rouge">serde::Serialize</code> is a bit bigger at 23 lines, but <code class="language-plaintext highlighter-rouge">serde::Deserialize</code> is
much bigger at 159 lines.</li>
  <li><code class="language-plaintext highlighter-rouge">arbitrary::Arbitrary</code> is also large, at 81 lines. You can’t tell it from
this table, but further inspection revealed that this derive was responsible
for the <code class="language-plaintext highlighter-rouge">thread_local!</code> and <code class="language-plaintext highlighter-rouge">thread_local_inner!</code> invocations, adding another
39 lines, for a total of 120 lines.</li>
</ul>

<p>All this for a tiny struct with just two fields? Interesting. Let’s try one
more example, adding this method code which uses an attribute macro and a
declarative macro from the <a href="https://crates.io/crates/tracing"><code class="language-plaintext highlighter-rouge">tracing</code></a> crate:</p>
<div class="language-plaintext highlighter-rouge"><div class="highlight"><pre class="highlight"><code>impl Point {
    #[tracing::instrument]
    fn invert(p: Point) -&gt; Point {
        tracing::debug!("invert the point");
        Point { x: -p.x, y: -p.y }
    }
}
</code></pre></div></div>
<p>Here’s the output for just that function:</p>
<div class="language-plaintext highlighter-rouge"><div class="highlight"><pre class="highlight"><code>===============================================================================
MACRO EXPANSION STATS: measure_proc_macros
Macro Name                         Uses    Lines  Avg Lines    Bytes  Avg Bytes
-------------------------------------------------------------------------------
::tracing::valueset!                  6       46        7.7    2_053      342.2
::tracing::event!                     2       35       17.5    1_551      775.5
::tracing::span!                      1       31       31.0    1_260    1_260.0
#[tracing::instrument]                1       34       34.0    1_238    1_238.0
::tracing::metadata!                  2       17        8.5    1_138      569.0
::tracing::callsite2!                 2       27       13.5    1_062      531.0
::tracing::level_enabled!             3        6        2.0      434      144.7
::tracing::fieldset!                  6        6        1.0      255       42.5
::tracing::if_log_enabled!            3       10        3.3      231       77.0
tracing::debug!                       1        2        2.0       86       86.0
::tracing_core::identify_callsite!    2        2        1.0       82       41.0
::tracing_core::__macro_support::module_path!
                                      2        2        1.0       42       21.0
module_path!                          2        2        1.0       42       21.0
::tracing::__macro_support::format_args!
                                      1        1        1.0       32       32.0
::tracing_core::__macro_support::file!
                                      2        2        1.0       26       13.0
::tracing::__macro_support::concat!   1        1        1.0       22       22.0
::tracing::__macro_support::file!     1        1        1.0       13       13.0
::tracing::__tracing_stringify!       1        1        1.0       13       13.0
::tracing_core::__macro_support::line!
                                      2        2        1.0       10        5.0
::tracing::__macro_support::line!     1        1        1.0        5        5.0
stringify!                            1        1        1.0        3        3.0
::tracing::__tracing_log!             2        2        1.0        0        0.0
===============================================================================
</code></pre></div></div>
<p>Wow! I did not expect that. That’s 232 lines of code and 20 auxiliary macros.
On this larger example the usefulness of the “average” columns becomes clear.</p>

<h2 id="using-it-in-practice">Using it in practice</h2>

<p>I know that <code class="language-plaintext highlighter-rouge">-Zmacro-stats</code> can be useful, because I used it on the
aforementioned example that saw 20% reductions in compile times. If your
codebase is littered with types with a dozen or more <code class="language-plaintext highlighter-rouge">derive</code>s, give it a shot.
If it tells you that a single proc macro macro is responsible for 25% of your
post-expansion code, then great! Chase that down. But you could also waste time
with it. Shaving off a few lines here and there is unlikely to have an effect.
This tool is aimed at large codebases; if your codebase is small this is
unlikely to be useful. As always with performance, measure to see if changes
are worthwhile. And remember that when talking about compilation, lines of code
is a potentially useful proxy measurement, but compile time is the true
measurement of interest.</p>

<p>If you do fall into the 25% case, what should you do? It depends greatly on
your codebase and how it uses the proc macro(s) in question. But in general,
two obvious solutions are (a) avoid the proc macro altogether, or (b) find a
cheaper alternative. For example, if <code class="language-plaintext highlighter-rouge">serde::Deserialize</code> is a big chunk of
your code and you are not relying on any of serde’s advanced features, an
alternative like <a href="https://crates.io/crates/serde-lite">serde-lite</a> or
<a href="https://crates.io/crates/miniserde">miniserde</a> might be worthwhile.</p>

<p>Finally, this is a very new tool so I’d love to hear from people who try it
out, successfully or not, and any ideas for improvement. Thanks!</p>]]></content><author><name></name></author><summary type="html"><![CDATA[Rust’s proc macros are powerful but tricky, and have some compile-time costs. This post is about a new tool to help quantify and reduce some of those costs.]]></summary></entry><entry><title type="html">How to speed up the Rust compiler in May 2025</title><link href="https://nnethercote.github.io/2025/05/22/how-to-speed-up-the-rust-compiler-in-may-2025.html" rel="alternate" type="text/html" title="How to speed up the Rust compiler in May 2025" /><published>2025-05-22T00:00:00+00:00</published><updated>2025-05-22T00:00:00+00:00</updated><id>https://nnethercote.github.io/2025/05/22/how-to-speed-up-the-rust-compiler-in-may-2025</id><content type="html" xml:base="https://nnethercote.github.io/2025/05/22/how-to-speed-up-the-rust-compiler-in-may-2025.html"><![CDATA[<p>It has been two months since my <a href="https://nnethercote.github.io/2025/03/19/how-to-speed-up-the-rust-compiler-in-march-2025.html">last
post</a>
on the Rust compiler’s performance. Time for a small update.</p>

<h2 id="benchmarks-updated">Benchmarks updated</h2>

<p>This update comes hot on the heels of the previous one because
<a href="https://github.com/Kobzol/">Jakub Beránek</a> and I
<a href="https://github.com/rust-lang/rustc-perf/issues/2024">updated</a> most of the
“primary” benchmarks in the <a href="https://github.com/rust-lang/rustc-perf/tree/master/collector/compile-benchmarks">rustc-perf benchmark
suite</a>.
These benchmarks are verbatim copies of third-party crates, and we have a
<a href="https://github.com/rust-lang/rustc-perf/tree/master/collector/compile-benchmarks#benchmark-update-policy">policy</a>
of updating them every three years to ensure we are measuring code that people
are using. This does impact data continuity, though we do have a set of old
“stable” benchmarks that never change, plus “secondary” benchmarks (e.g.
microbenchmarks) that rarely change.</p>

<h2 id="general-progress">General Progress</h2>

<p>For the period 2025-03-17 to 2025-05-20 you can see the results on the primary
metrics here:
<a href="https://perf.rust-lang.org/compare.html?start=8279176ccdfd4eebd40a671f75b6d3024ae56b42&amp;stat=wall-time&amp;showRawData=true&amp;tab=compile&amp;end=2b96ddca1272960623e41829439df8dae82d20af&amp;nonRelevant=true">wall-time</a>,
<a href="https://perf.rust-lang.org/compare.html?start=8279176ccdfd4eebd40a671f75b6d3024ae56b42&amp;stat=max-rss&amp;showRawData=true&amp;tab=compile&amp;end=2b96ddca1272960623e41829439df8dae82d20af&amp;nonRelevant=true">peak memory
usage</a>,
and <a href="https://perf.rust-lang.org/compare.html?start=8279176ccdfd4eebd40a671f75b6d3024ae56b42&amp;stat=size%3Alinked_artifact&amp;showRawData=true&amp;tab=compile&amp;end=2b96ddca1272960623e41829439df8dae82d20af&amp;nonRelevant=true">binary
size</a>.
I won’t go in to detail because none of them changed that much. This is a good
thing! Because of the benchmarks update we only had 25 benchmarks (mostly
secondary benchmarks) measured across the period, instead of the usual 43. My
next update will include all the new benchmarks.</p>

<h2 id="one-notable-improvement">One notable improvement</h2>

<p><a href="https://github.com/rust-lang/rust/pull/140561">#140561</a>: In this PR,
<a href="https://github.com/compiler-errors">Michael Goulet</a> made a fairly small change
to how local variables are gathered by the type checker, making the gathering
lazier. This gave an impressive 10%+ reduction in compile times for certain
<code class="language-plaintext highlighter-rouge">check</code> builds of the <code class="language-plaintext highlighter-rouge">cranelift-codegen-0.119.0</code> benchmark, because it made
obligation processing faster. I don’t really understand the effect, but it does
make me wonder if there is some kind of custom profiling/logging we could do to
identify sub-optimal obligation processing.</p>]]></content><author><name></name></author><summary type="html"><![CDATA[It has been two months since my last post on the Rust compiler’s performance. Time for a small update.]]></summary></entry><entry><title type="html">A home free from fossil fuels</title><link href="https://nnethercote.github.io/2025/04/08/a-home-free-from-fossil-fuels.html" rel="alternate" type="text/html" title="A home free from fossil fuels" /><published>2025-04-08T00:00:00+00:00</published><updated>2025-04-08T00:00:00+00:00</updated><id>https://nnethercote.github.io/2025/04/08/a-home-free-from-fossil-fuels</id><content type="html" xml:base="https://nnethercote.github.io/2025/04/08/a-home-free-from-fossil-fuels.html"><![CDATA[<p>My house is now free from the direct burning of fossil fuels. Here’s how I did
it.</p>

<h2 id="car">Car</h2>

<p>In March 2021 I replaced my old car with a Tesla Model 3. At that time the
range of electric vehicles available in Australia was meagre and the Model 3
was an easy choice. It has been great. It’s fast, quiet, smooth, and reliable.
I love <a href="https://www.racv.com.au/royalauto/transport/electric-vehicles/what-is-one-pedal-driving-explained.html">one-pedal
driving</a>.
I haven’t paid for petrol in four years. I don’t want to ever own an ICE car
again.</p>

<p>I charge it from a normal power point in my garage. It takes more than 24 hours
to fully charge the battery from empty, but that’s a rare use case for me.
Topping up 20-50% overnight is much more common. You can get a special home
charger that’s 3.5x faster but I haven’t bothered. My model has an <a href="https://en.wikipedia.org/wiki/Lithium_iron_phosphate_battery">LFP
battery</a> which
tolerates being charged to 100% regularly, which I like a lot. Charging at home
is fantastic, and if you don’t have some kind of off-street parking (garage,
carport, or even just a small driveway) that allows this, an EV is a lot less
enticing.</p>

<p>I also mostly do city driving. I have used Tesla superchargers on longer drives
a few times. This has worked fine, but there aren’t that many of them around
and it could be inconvenient if I did lots of long country drives.</p>

<p>Maintenance-wise it’s a dream. Do you know how complicated internal combustion
engines are? How many moving parts they have? Electric motors are trivial in
comparison. No sparkplugs, belts, chains, or pistons. No transmission! (And no
transmission hump in the floor.) I’ve never seen my car’s motor. It’s not
accessible, because it doesn’t need to be. There is no regular motor
maintenance to be done by the owner. No changing the oil, no topping up the
radiator. Tyres and windscreen wipers are the main things that need attention.
Even brake pads and brake fluid last much longer than ICE cars because
regenerative braking does 99% of the job when slowing down.</p>

<p>It doesn’t have full self-driving because (a) I wouldn’t trust that, and
(b) it’s not legal in Australia.</p>

<p>Unfortunately, over the past four years Elon Musk has gone from “distasteful”
to “serious candidate for worst person in the world”. My car now has a sticker
that says “I bought this before we learned Elon was crazy”. The very first day
the sticker was applied I got a yell of approval about it from another Tesla
driver. Even though this car has been great for me I wouldn’t buy another Tesla
now, because of the brand association and the <a href="https://bsky.app/profile/nnethercote.bsky.social/post/3lavhdxdj4223">general
direction</a>
of the company. I also don’t want to sell it, because it’s working well for me,
and I hate buying and selling cars, and it’s not obvious what non-Tesla EV
is the best alternative. Hrmph.</p>

<h2 id="hot-water">Hot water</h2>

<p>Two years ago I replaced my gas hot water tank with a <a href="https://reclaimenergy.com.au/">Reclaim
Energy</a> one that uses an electric heat pump. It
was pretty straightforward and the new tank has worked flawlessly.</p>

<p>I was always slightly terrified by just how intense the old gas tank’s flames
were, that “whoosh” sound when it kicked in, and I’ve never liked the idea of a
pilot light that was always burning. The new tank doesn’t feel like it could
one day accidentally blow my house up. That’s a nice feeling.</p>

<h2 id="stove-top">Stove top</h2>

<p>Shortly after I replaced the hot water tank I replaced my gas stove top with an
Asko electric induction stove top. This required running a new electrical
circuit to the kitchen. Fortunately the fusebox had enough capacity so it
wasn’t a big deal.</p>

<p>Induction cooking takes a little getting used to and I had to replace some
aluminium pots and pans with steel ones, but now I really like it. It can
produce prodigious amounts of heat, even more than the old gas wok burner.</p>

<p>It is also an absolute dream to clean. I wipe it down in a few seconds every
time after cooking. Compare that with the old gas stove top which I would clean
half-heartedly about once a week and properly about once a quarter. I don’t
miss those filthy metal rings and grates.</p>

<p>I also don’t miss the air pollutants from burning gas inside a house. Did you
know that <a href="https://www.nationalasthma.org.au/living-with-asthma/resources/patients-carers/factsheets/gas-stoves-and-asthma-in-children">12% of childhood asthma in Australia can be attributed to the use of
gas stoves for
cooking?</a>
The history of the study of air pollution on human health is basically a
never-ending cycle of scientists concluding “it’s even worse than we thought”.</p>

<h2 id="heating">Heating</h2>

<p>Last month I replaced the house’s heating and cooling system. I had a ducted
system with a gas heater and an add-on air conditioner. It was fifteen years
old and the air conditioner broke down irreparably. My house has some
<em>interesting</em> space constraints and I received some opinions that I should
switch to per-room split systems but I ended up choosing a ducted Daikin heat
pump (a.k.a. reverse-cycle air conditioner) that heats and cools. Technology
has come along nicely here: the new unit is more powerful but also quieter than
the old system; it can run at multiple speeds instead of just being fully on or
off; and it’s smaller, so I have a little more space along the side of the
house.</p>

<h2 id="bits-and-pieces">Bits and pieces</h2>

<p>I have made a request with the gas company to disconnect my house from the gas
network and remove the gas meter. It should be done within a couple of weeks.
My contribution to the <a href="https://reneweconomy.com.au/gas-network-death-spiral-pressure-mounts-to-protect-consumers-from-cost-of-stranded-assets/">gas death
spiral</a>.</p>

<p>I do still have one fossil fuel device: a barbecue powered by a gas bottle. But
that barbecue gets used about twice a year and probably accounts for about
0.01% of the fossil fuels that were used by the old car, stove top, hot water
tank, and heater, so I’m happy to treat it as a rounding error and declare
victory.</p>

<p>You might be wondering about the usual question: how is the electricity used by
these new machines generated? Before I answer that, note that these kinds of
electric machines are generally less polluting even when run on electricity
generated entirely from fossil fuels, because they are so much more
energy-efficient. E.g. an EV typically converts more than 90% of energy in the
battery into kinetic energy; the corresponding figure for an ICE car is more
like 25-30%. Heat pumps and induction stove tops are also extremely efficient.</p>

<p>Fortunately, my situation is much better than that baseline. First, I have a
small (2 KW) solar panel system that covers some of my electricy usage. Beyond
that, most of my electricity does come from the grid, but <a href="https://cleanenergycouncil.org.au/news-resources/emissions-reductions-renewables">more than 40% of
Australia’s electricity supply is now
renewable</a>.
That proportion has tripled in less than ten years, and the federal government
has a <a href="https://www.energycouncil.com.au/analysis/the-82-per-cent-national-renewable-energy-target-where-did-it-come-from-and-how-can-we-get-there/">target of 82% renewables by
2030</a>
which appears to be more or less on target. So these new machines will become
less polluting as time goes on.</p>

<p>Replacing any large machine is always a pain, but it’s worth noting that, <em>even
if you ignore the environmental side of things</em>, the new electric machines are
all better than the old fossil fuel machines they replace: quieter, safer,
smoother, and cheaper to run. No hair shirts required.</p>

<p>Saul Griffith’s <a href="https://www.amazon.com.au/Big-Switch-Australias-Electric-Future/dp/1760643874">The Big Switch: Australia’s Electric
Future</a>
is an excellent resource for anyone wanting to learn more about
electrification.</p>]]></content><author><name></name></author><summary type="html"><![CDATA[My house is now free from the direct burning of fossil fuels. Here’s how I did it.]]></summary></entry><entry><title type="html">How to speed up the Rust compiler in March 2025</title><link href="https://nnethercote.github.io/2025/03/19/how-to-speed-up-the-rust-compiler-in-march-2025.html" rel="alternate" type="text/html" title="How to speed up the Rust compiler in March 2025" /><published>2025-03-19T00:00:00+00:00</published><updated>2025-03-19T00:00:00+00:00</updated><id>https://nnethercote.github.io/2025/03/19/how-to-speed-up-the-rust-compiler-in-march-2025</id><content type="html" xml:base="https://nnethercote.github.io/2025/03/19/how-to-speed-up-the-rust-compiler-in-march-2025.html"><![CDATA[<p>It has been just over a year since my <a href="https://nnethercote.github.io/2024/03/06/how-to-speed-up-the-rust-compiler-in-march-2024.html">last
update</a>
on the Rust compiler’s performance. Let’s get into it. The information about
metrics at the top of <a href="https://nnethercote.github.io/2022/10/27/how-to-speed-up-the-rust-compiler-in-october-2022.html">this
post</a>
still applies.</p>

<h2 id="notable-improvements">Notable improvements</h2>

<p><a href="https://github.com/rust-lang/rust/pull/124129">#124129</a>: In this PR, <a href="https://github.com/lqd/">Rémy
Rakic</a> made lld the default linker for the nightly
compiler on x86-64/Linux. lld is much faster than the system linkers, and this
change reduced the wall-time for several benchmark results by 30% or more. The
idea of using lld first <a href="https://github.com/rust-lang/rust/issues/39915">came up in
2017</a> and took a surprising
amount of time and effort to get into a shippable state; many thanks to Rémy
for getting it over the line. You can enable lld on other configurations by
following <a href="https://nnethercote.github.io/perf-book/build-configuration.html#linking">these
instructions</a>.
Manual enabling has been possible for a long time, but defaults matter and it’s
good to get wider exposure for this feature. Read more in the <a href="https://blog.rust-lang.org/2024/05/17/enabling-rust-lld-on-linux.html">announcement
blog
post</a>.
Work is underway to enable lld on stable releases.</p>

<p><a href="https://github.com/rust-lang/rust/pull/133807">#133807</a>: In this PR, <a href="https://github.com/mrkajetanp">Kajetan
Puchalski</a> enabled PGO for ARM64/Linux, giving
10-20% speedups across pretty much all benchmarks on that platform. Great work!</p>

<p><a href="https://github.com/rust-lang/rust/pull/127513">#127513</a>,
<a href="https://github.com/rust-lang/rust/pull/135763">#135763</a>: In these PRs, <a href="https://github.com/nikic">Nikita
Popov</a> upgraded the LLVM version used by the compiler
to LLVM 19 and then LLVM 20. These PRs gave a mean wall-time reduction across
all benchmarks results of
<a href="https://perf.rust-lang.org/compare.html?start=e552c168c72c95dc28950a9aae8ed7030199aa0d&amp;end=0b5eb7ba7bd796fb39c8bb6acd9ef6c140f28b65&amp;stat=instructions%3Au&amp;nonRelevant=true">1.33%</a>
and
<a href="https://perf.rust-lang.org/compare.html?start=2162e9d4b18525e4eb542fed9985921276512d7c&amp;end=ce36a966c79e109dabeef7a47fe68e5294c6d71e&amp;stat=instructions%3Au&amp;nonRelevant=true">0.78%</a>.
Every LLVM major update for several years has made the Rust compiler faster.
This is not due to some law of nature. Rather, it reflects sustained, excellent
work from the LLVM developers. Kudos to them.</p>

<p><a href="https://github.com/rust-lang/rust/pull/132566">#132566</a>: In this PR, <a href="https://github.com/saethlin">Ben
Kimock</a> made a hard-to-describe change to how
monomorphization works. If we look just at incremental builds that involve code
generation, it gave a mean wall-time reduction across all benchmark results of
<a href="https://perf.rust-lang.org/compare.html?start=5afd5ad29c014de69bea61d028a1ce832ed75a75&amp;end=ee4a56e353dc3ddfcb12df5fe2dc1329a315c2f5&amp;stat=wall-time&amp;check=false&amp;full=false&amp;incrFull=false&amp;doc=false&amp;nonRelevant=true&amp;showRawData=true">5.00%</a>,
with a handful exceeding 20%. These results are somewhat inflated by an
artifact of how the benchmarks are measured (see the PR description for
details) and in practice the real improvements were probably between half and
two-thirds of what was measured. Still a very impressive improvement for a
single change.</p>

<p><a href="https://github.com/rust-lang/rust/pull/136771">#136771</a>: In this PR,
<a href="https://github.com/scottmcm">scottmcm</a> simplified <code class="language-plaintext highlighter-rouge">slice::Iter::next</code> enough
that it can be inlined. This resulted in a mean cycle reduction across all
benchmark results of
<a href="https://perf.rust-lang.org/compare.html?start=28b83ee59698ae069f5355b8e03f976406f410f5&amp;end=f04bbc60f8c353ee5ba0677bc583ac4a88b2c180&amp;stat=cycles%3Au&amp;nonRelevant=true">0.34%</a>.
This change is likely to slightly speed up a lot of other Rust programs as
well, because slice iteration is extremely common.</p>

<p><a href="https://github.com/rust-lang/rust/pull/133793/commits">#133793</a>: The Rust
compiler has excellent error messages, but sometimes this comes at a
performance cost. You may have seen syntax errors that look like this:</p>
<div class="language-plaintext highlighter-rouge"><div class="highlight"><pre class="highlight"><code>error: expected one of `:`, `@` or `|`, found `,`
</code></pre></div></div>
<p>To generate these, the parser maintained a vector of tokens called
<code class="language-plaintext highlighter-rouge">expected_token_types</code> that was constantly updated. The compiler’s token type
is more heavyweight than you might expect. It does not implement <code class="language-plaintext highlighter-rouge">Copy</code> and so
the token pushing requires calls to <code class="language-plaintext highlighter-rouge">clone</code> and the clearing requires calls to
<code class="language-plaintext highlighter-rouge">drop</code>. (I’m nearing the end of a <a href="https://github.com/rust-lang/rust/pull/124141">long-term project to fix
this</a>.) In this PR I changed
this vector to use a simpler type which made the pushing and clearing much
cheaper. This gave icount wins across many benchmarks, the best being 2.5%.</p>

<p><a href="https://github.com/rust-lang/rust/pull/131481">#131481</a>: I previously wrote
about this PR of mine in a <a href="https://nnethercote.github.io/2024/12/19/streamlined-dataflow-analysis-code-in-rustc.html">post about dataflow
analysis</a>.
It was a small performance win, giving sub-1% instruction count reductions on a
few benchmarks. But it was interesting because it involved <em>removing</em> a
supposed optimization that was actually a pessimization in practice. Removing
it made the code shorter (500+ lines of code removed). I don’t know if this
“optimization” was always a pessimization. Perhaps it was once a speed win but
that changed over time as other things around it changed. It’s a good reminder
that writing high performance code isn’t easy, and it’s always good to keep
measuring things.</p>

<h2 id="startup">Startup</h2>

<p>There were also some improvements relating to startup.</p>

<p><a href="https://github.com/rust-lang/rust/pull/131634">#131634</a>: In this PR <a href="https://github.com/davidlattimore">David
Lattimore</a> used protected visibility for
symbols when building <code class="language-plaintext highlighter-rouge">rustc_driver</code>. This is an arcane symbol/linker thing I
won’t pretend to understand that somehow shaves about 10-12 million
instructions off startup, on Linux at least. For a <code class="language-plaintext highlighter-rouge">check</code> build of “hello
world” that was a 31% icount reduction!</p>

<p><a href="https://github.com/rust-lang/rust/pull/137586">#137586</a>: This is a funny one.
When profiling very short running compilations, e.g. a <code class="language-plaintext highlighter-rouge">check</code> build of “hello
world”, the single hottest function was something in LLVM called
<code class="language-plaintext highlighter-rouge">SetImpliedBits</code>. It accounted for almost 20% of the ~26 million instructions
executed. This function is used when checking LLVM’s support for code
generation features, such as SSE2, AVX, etc. On x86 and x86-64 CPUS there are
60+ such features that need to be checked. Each one requires the Rust compiler
to call into LLVM, and the code on the LLVM side is very, uh, sub-optimal.
Furthermore, I discovered that the Rust compiler was actually checking every
feature twice, once when considering stable features and once when considering
both stable and unstable features. In this PR I eliminated this second check
for each feature, which gave almost 10% icount reductions in the best case.
This benefit should be seen on x86 and x86-64 across all operating systems. On
other architectures it will be smaller because they have fewer features to
check.</p>

<p><a href="https://github.com/llvm/llvm-project/pull/130936">LLVM #130936</a>: Nikita Popov
made a related change to fix the sub-optimal (“implemented in a really stupid
fashion”) feature checking within LLVM. When the next LLVM major update happens
we should see another ~10% icount win for “hello world”, and <code class="language-plaintext highlighter-rouge">SetImpliedBits</code>
will no longer confuse people by clogging up Cachegrind profiles of these
short-running compiler invocations.</p>

<p>The wall-time improvements of all these startup changes are likely in the order
of a few milliseconds, which is too small to measure reliably. There are two
ways to look at this. The pessimistic view is to observe that it’s well below
what a human would notice. The optimistic view is to note that these
milliseconds are shaved off every single invocation of the compiler, and this
can only be a good thing. I choose the latter.</p>

<h2 id="general-progress">General Progress</h2>

<p>For the period 2024-03-04 to 2025-03-17 we had some reasonably good overall
performance results.</p>

<p>First,
<a href="https://perf.rust-lang.org/compare.html?start=50e77f133f8eb1f745e05681163a0143d6c4dd7d&amp;stat=wall-time&amp;showRawData=true&amp;nonRelevant=true&amp;tab=compile&amp;end=8279176ccdfd4eebd40a671f75b6d3024ae56b42">wall-time</a>:</p>
<ul>
  <li>There were 526 results measured across 43 benchmarks.</li>
  <li>306 of these were improvements, and 220 were regressions. The mean change was
a reduction of 6.37%. Plenty of the reductions were in the double digits,
some exceeding 50%. Most of the regressions were in the single digits.</li>
</ul>

<p>Next, <a href="https://perf.rust-lang.org/compare.html?start=50e77f133f8eb1f745e05681163a0143d6c4dd7d&amp;stat=max-rss&amp;showRawData=true&amp;nonRelevant=true&amp;tab=compile&amp;end=8279176ccdfd4eebd40a671f75b6d3024ae56b42">peak memory
usage</a>:</p>
<ul>
  <li>Again, there were 526 results measured across 43 benchmarks.</li>
  <li>149 of these were improvements, and 377 were regressions. The mean change was
a 2.87% increase, and most of the changes were in the single digits.</li>
</ul>

<p>Finally, <a href="https://perf.rust-lang.org/compare.html?start=50e77f133f8eb1f745e05681163a0143d6c4dd7d&amp;stat=size%3Alinked_artifact&amp;tab=compile&amp;end=8279176ccdfd4eebd40a671f75b6d3024ae56b42&amp;nonRelevant=true&amp;showRawData=true">binary
size</a>:</p>
<ul>
  <li>There were 324 results measured across 43 benchmarks.</li>
  <li>178 of these were improvements, and 146 were regressions. The mean change was
a 1.95% reduction, and most of the changes were in the single digits.</li>
  <li>If we restrict things to <a href="https://perf.rust-lang.org/compare.html?start=50e77f133f8eb1f745e05681163a0143d6c4dd7d&amp;stat=size%3Alinked_artifact&amp;tab=compile&amp;end=8279176ccdfd4eebd40a671f75b6d3024ae56b42&amp;nonRelevant=true&amp;showRawData=true&amp;debug=false&amp;check=false&amp;doc=false&amp;incrUnchanged=false&amp;incrFull=false&amp;incrPatched=false">non-incremental release
builds</a>,
which is the most interesting case for binary size, there were 17
improvements, 26 regressions, and the mean change was a reduction of 0.10%.</li>
</ul>

<p>For all three metrics, all but a handful of results met the significance
threshold. I haven’t bothered separating those results because they made little
difference to the headline numbers. As always, these measurements are done on
Linux.</p>

<p>In short, speed generally improved; memory usage regressed a small amount,
probably not enough to be noticeable; and binary size didn’t change much.</p>

<p>Over the past year I have not spent that much time on compiler performance. For
the rest of this year I hope to change that by working on both incremental
compilation and parallelism in the front end. These are areas of the compiler
that are complex, but have potential for significant speed improvements.</p>

<p>One final thing: we will be <a href="https://github.com/rust-lang/rustc-perf/issues/2024">updating the rustc-perf benchmark
suite</a> soon, as per
policy, because it has been three years since the last update. This will mostly
consist of updating the real-world crate benchmarks (e.g. <code class="language-plaintext highlighter-rouge">serde</code>) to their
latest versions. This is to ensure we are benchmarking representative code.</p>]]></content><author><name></name></author><summary type="html"><![CDATA[It has been just over a year since my last update on the Rust compiler’s performance. Let’s get into it. The information about metrics at the top of this post still applies.]]></summary></entry></feed>