Twenty years of Valgrind
It has been twenty years since Valgrind 1.0 was released.
The Valgrind website says:
Valgrind is an instrumentation framework for building dynamic analysis tools. There are Valgrind tools that can automatically detect many memory management and threading bugs, and profile your programs in detail. You can also use Valgrind to build new tools.
–
I first met Julian Seward in late 2001. I had moved from Australia to Cambridge in the UK to pursue a PhD on the topic of “cache optimizations for functional languages”. The Cambridge Computer Laboratory is literally next door to a Microsoft Research office, and I was soon interacting with the people there working on the Glasgow Haskell Compiler. Julian was one of them.
Shortly after that, Julian’s stint working on GHC came to a close. On his last day he dropped by my office in the Computer Laboratory to say goodbye. I asked what he would be doing now, and he said he was going to spend some time on a project of his called Valgrind. “What’s Valgrind?” I asked. It was one of those this-will-change-your-life moments.
–
In the mid-90s Julian wrote the bzip2 compression utility. He had spent some time investigating its cache behaviour in order to make it faster. While doing this he created a cache profiling tool called cacheprof. It parsed and annotated assembly code in order to add instrumentation code, gave line-by-line annotations of cache misses in your source code, and came with a wrapper around gcc to make its usage straightforward. (Section 7 of the cacheprof docs have more details about its origins.)
Julian was also a fan of Purify, a commercial tool that detected memory errors in programs at runtime and ran on Solaris. He hoped that someone would make an open source version for x86/Linux, but eventually decided to do it himself. He had some experience with an x86 binary interpreter called Heimdall, but knew that binary interpretation was too slow to be practical. Perhaps JIT compilation could help?
After a great deal of effort he had a working memory error detector, which ended up with the name Valgrind. It was language independent and didn’t require any pre-instrumentation of source code. It worked pretty well, could handle large programs, and was getting some use from KDE developers.
All this was an impressive achievement, because Valgrind has to do a lot of clever and/or nasty low-level things to work. It has to intercept every instruction executed by a client program without ever losing control, even in the face of syscalls, signals, and longjmp. And on top of that it has to add large amounts of instrumentation to maintain metadata about literally every bit of data the client program manipulates.
–
When Julian showed me Valgrind I thought it was pretty cool. I got a copy of the code and submitted a few small improvements.
I had been using cacheprof myself, but its assembly annotation approach was fragile and didn’t provide any coverage for system libraries. Not long after learning about Valgrind I realised its dynamic binary instrumentation could provide a more robust foundation for a cache profiling tool. I wrote Cachegrind and it was committed into the repository in April 2002.
In July 2002, Valgrind 1.0 was released. The SlashDot post said:
Valgrind is a C/C++ programmer’s dream come true: effortless memory allocation checking, uninitialised memory access, leaks etc. Purify for Linux has arrived, only better: contrary to its commercial (non-Linux) sibling, checking is performed directly on the executable, no re-linking necessary.
At this point Valgrind did two things. By default it would look for memory
errors, but you could invoke Cachegrind with the --cachesim option. The
integration between the two modes was clunky, but both were useful.
I then realised there was a potential clean split between the generic instrumentation code and the tool-specific code. A few months later I made this split, which opened up a new world of possibilities. Memcheck was born: it became the name of the tool that did the original memory checking, and Valgrind became the name of the entire system. (Having said that, even today “Valgrind” and “Memcheck” are basically synonymous.) And Cachegrind was no longer bolted on as an awkward extra piece.
We called this the “core/skin split”. These names were my choice, inspired by
the custom UI “skins” you could put on software MP3 players at the time. A
while later we realised “skin” was a dumb and confusing name, and we switched
to “tool”. The name “core” has stuck, although we changed the name of the
directory holding the core code from core to coregrind after learning that
some Linux systems were configured to periodically delete any file named
core, on the assumption that such files are core dumps!
Around this time we were joined by many talented folks who made important contributions. In particular, Jeremy Fitzhardinge greatly improved the tricky intersection point of threads, system calls, and signals, and Tom Hughes fixed many early bugs and improved debuginfo reading.
More tools followed.
- Julian wrote a data race detector called Helgrind.
- Josef Weidendorfer wrote a souped-up version of Cachegrind called Callgrind.
- In 2003 I wrote Massif, a heap profiler.
- In 2007 Bart Van Assche wrote DRD, a different kind of race detector.
- In 2010 Julian wrote DHAT, a different heap profiler. It could do some incredible stuff but the text-based output was clunky. In 2019 I overhauled it to have a much nicer UI.
- Various other lesser-known tools have been written, some of which were used as the basis for research papers.
–
After the core/tool split I switched the topic of my PhD away from functional programming. I finished my dissertation, entitled Dynamic Binary Analysis and Instrumentation, in late 2004. I wouldn’t recommend reading it today, except perhaps chapter 3 which is a decent description of how Cachegrind works. However, it was enough for me to graduate and forevermore tell people that, literally, “I have a PhD in Valgrind”. (This was a three year UK PhD, rather than a brutal six-or-more year US PhD. To any potential graduate students reading this: 10/10, would recommend.)
In 2005 we published a paper at USENIX entitled Using Valgrind to detect undefined value errors with bit-precision. We only learned about the conference two days before the paper deadline, when an organiser of the co-located FREENIX workshop suggested we submit an abstract for a paper about Valgrind to FREENIX. We proposed submitting a paper to USENIX instead and were told “it’s not possible to do a USENIX paper in two days”. Forty-eight frantic hours later we did and it was accepted, hooray!
That paper focused Memcheck’s definedness checking. This is the part that tracks the definedness of every bit of data that a client program touches, and determines if the client program does anything dangerous with undefined or partially-defined values, such as branching on a condition that uses an undefined value, or passing an undefined value to a system call, or using an undefined value as an address in a memory operation. It’s a very elegant system that Julian invented, combining both speed and precision. Even today, it’s still a unique advantage of Memcheck over similar checking tools.
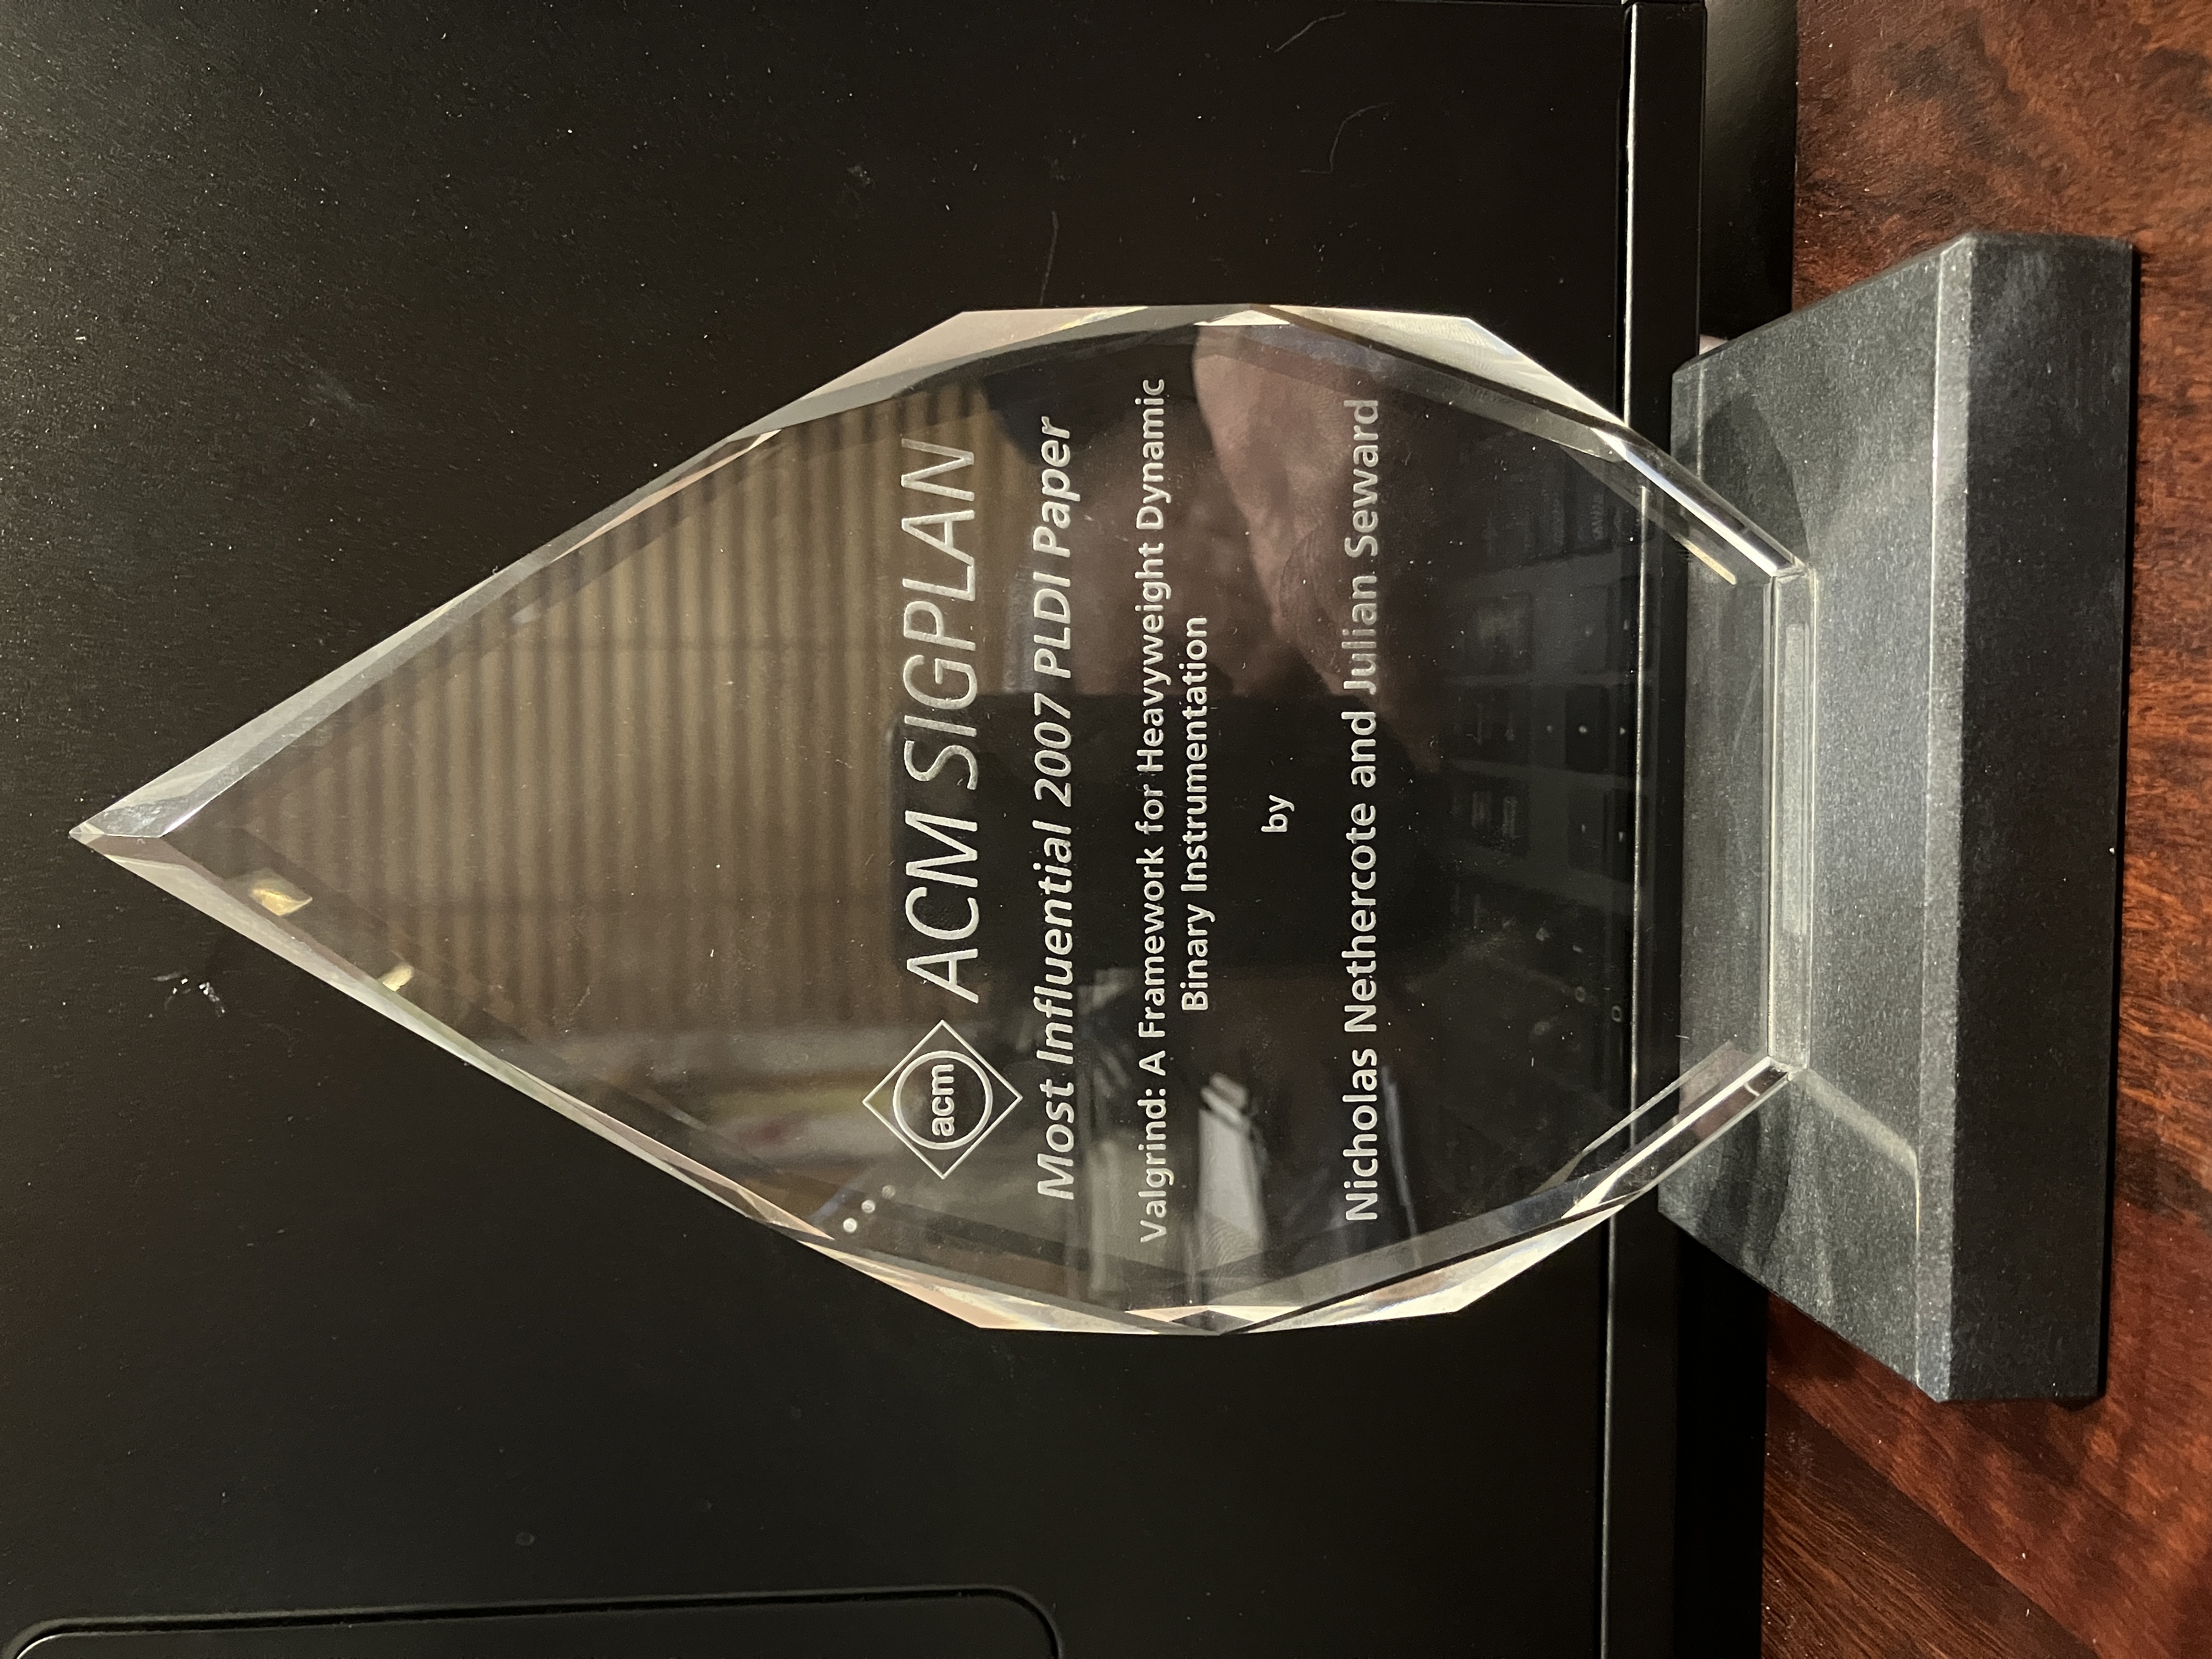
In 2007 we published two papers. The first paper was at PLDI, entitled
Valgrind: A Framework for Heavyweight Dynamic Binary
Instrumentation. This one took a lot longer than two
days. It’s still the best overview of Valgrind’s internals, and the most cited
paper about Valgrind. Ten years later, it won a most influential
paper weapon award. I sure wasn’t
expecting that.
The second paper was at VEE, entitled How to Shadow Every Byte of Memory Used by a Program. It gives a nice overview of how Memcheck tracks extra state about every value in memory.
There were some other awards, too.
- In 2004 Valgrind won a merit (bronze) Open Source Award. (This interview with Julian from the time has some good historical information.)
- In 2006 Julian won a Google-O’Reilly Open Source Award for “Best Toolmaker”.
- In 2008 Valgrind won TrollTech’s inaugural Qt Open Source Development Award for the best open source development tool.
–
By 2010 I was fully out of academia and no longer writing research papers. Julian and I had both ended up at Mozilla, where I worked for twelve years and where Julian still is. Our involvement in Valgrind has gradually declined—mine much earlier than Julian’s—and our statuses today would best be described as “emeritus”. There have been many other contributors over the years, and Mark Wielaard is today the lead maintainer.
–
It’s both delightful and surreal to see that Valgrind is still in wide use today. Julian’s original goal was to raise the bar when it came to correctness for C and C++ programs. This has clearly been a huge success. Memcheck has found countless bugs in countless programs, and is a standard part of the testing setup for many of them.
It did take a while to penetrate, though. In 2005 I did a postdoc where I worked on a project involving novel hardware design. There were several C programs that simulated the hardware being designed. Students would run the programs overnight to simulate a small amount of machine time. Sometimes when they returned in the morning the simulations would have crashed, which was a big time waster. I suggested they try Memcheck, which found a few problems that they fixed, and the programs stopped crashing. But the response wasn’t a “that fixed the problem!” so much as a “huh, that problem seems to have gone away”.
Thankfully, with time, the value of Memcheck has become more deeply appreciated. I’m pretty sure that ASan was directly inspired by Memcheck. ASan uses static instrumentation, which means it is faster than Memcheck but has incomplete coverage, e.g. for runtime generated code and system libraries. For this reason it does what Memcheck does except the definedness checking, because that part requires 100% instrumentation coverage to work reliably.
Speaking of software quality, I think it’s fitting that I now work full time on Rust, a systems programming language that didn’t exist when Valgrind was created, but which basically prevents all the problems that Memcheck detects. As a result, I don’t have much use for Memcheck, but I still use Cachegrind, Callgrind, and DHAT all the time. I’m amazed that I’m still using Cachegrind today, given that it has hardly changed in twenty years. (I only use it for instruction counts, though. I wouldn’t trust the icache/dcache results at all given that they come from a best-guess simulation of an AMD Athlon circa 2002.) And DHAT is an ongoing source of joy: I’ve never used any other profiler as good at telling me precisely what I want to know.
–
These are some of my Valgrind stories from the past twenty years. It’s far from a complete account, but I hope it has been interesting.
To finish, I’ll quote the first entry in the Valgrind FAQ, which I wrote a long time ago:
1.1. How do you pronounce “Valgrind”?
The “Val” as in the word “value”. The “grind” is pronounced with a short ‘i’ – ie. “grinned” (rhymes with “tinned”) rather than “grined” (rhymes with “find”).
Don’t feel bad: almost everyone gets it wrong at first.
Happy birthday, Valgrind!