How to speed up the Rust compiler in July 2026
My last post on the Rust compiler’s performance was in December 2025. Let’s see what has happened since then.
Overall progress
The measurements for the period 2025-12-03 to 2026-07-29 can be seen here.
The mean wall-time reduction was a healthy 5.59%. Around half of this was due to some huge recent improvements in rustdoc, which saw a mean wall-time reduction of 37.92%! With the rustdoc changes excluded, the mean wall-time change was 2.90%, which is still a good result. There were also some major improvements to the speed of Clippy, which isn’t currently measured by rustc-perf on CI. (More about that below.)
rustdoc
#159623, #159721, #159779, #159854: In these PRs, Noah Lev greatly reduced the amount of work done when processing impls. I won’t pretend to understand what he did in any more detail than that (see here for some background) but I do know it resulted in many double- and single-digit percentage reductions in wall-times. Guillaume Gomez said “all of that because someone encountered a weird bug when using rustdoc”.
#159091: In this PR Jakub Beránek added rustdoc benchmarks to the PGO training set, which lets rustdoc benefit more from PGO. This gave a mean 2.85% reduction in wall-time across all the rustdoc benchmarks, with the largest reduction exceeding 6%. PGO is fiddly to set up but it can really make a difference, and the training set matters.
#157179: In this PR I changed the way rustdoc sorts impls. Previously it was sorting long generated HTML strings containing impl names; now it uses a much shorter text representation of the impl name as the sort key. This reduced instruction counts across multiple benchmarks, in the best case by more than 6%.
The combined effect of these improvements can be seen in the following graph of the relative wall-time of all the rustdoc benchmarks.
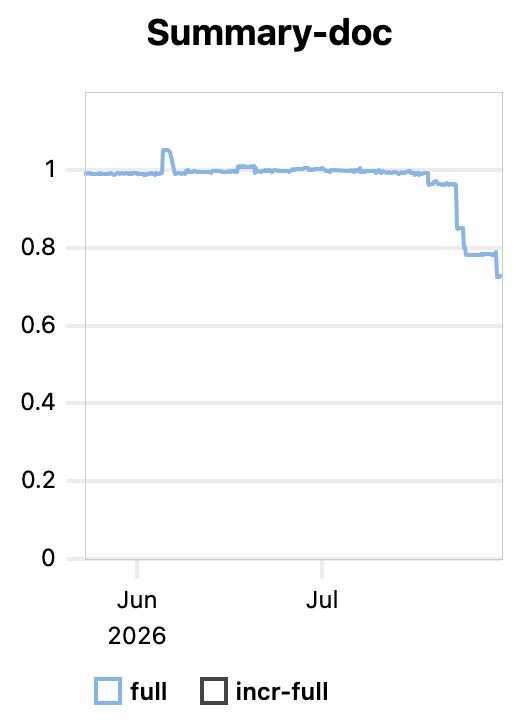
That’s a 28% reduction!
#2515: On a different note, in this PR Jakub enabled rustdoc-json benchmarking on rustc-perf. This will be helpful for the speed of tools that use rustdoc’s JSON output, such as cargo-semver-checks.
Clippy
#17124,
#17132: In these two
PRs, xmakro made some huge speed-ups to Clippy.
Clippy consists of hundreds of separate lints, each of which can implement one
or more of a few dozen visitor methods: check_item, check_stmt, check_expr,
etc. Clippy traverses the AST and HIR and for each node it calls the
appropriate check_foo method for every lint on that node. Each call is a
virtual dispatch. Critically, most of these calls are no-ops because most lints
only implement a small number of check_foo methods (often just one). In these
PRs, xmakro found a way to combine the passes so that the empty check_foo
methods (i.e. the vast majority) are not called.
Around the same time I was investigating the exact same issue, and I came up with a slightly different solution in #157762. My solution was functionally equivalent but the code changes were less elegant and more invasive than xmakro’s. The PR didn’t merge, but I was able to get more detailed measurements: in most cases this reduced Clippy’s runtime by 10-30%! Branch mispredictions were reduced by 20-80% on real-world examples and by 97% on one stress test. The cost of virtual dispatch adds up if you do it a lot.
Even though I’ve been working on Rust compiler performance for ten years, this was the first time I tried to optimize Clippy. I found a major performance problem and fixed it, only to find someone else had beaten me to it by a few days. I’m not sad because the better solution was merged, but I am still surprised—what are the chances of that?
Incremental compilation
We saw a number of minor improvements to incremental compilation.
#153122: In this PR Zalathar improved how incremental compilation promotes disk-cached values into memory, reducing instruction counts on many benchmarks, in the best case by 6%.
#153521: This PR was another tweak to incremental compilation by Zalathar, reducing instruction counts on many benchmarks, in the best cases by more than 2%.
#154304: In this PR zetanumbers adjusted how the typeck query works, for instruction count reductions across multiple benchmarks, in the best case by 6%.
#157781: In this PR xmakro tweaked incremental compilation for instruction count reductions across many benchmarks, in the best case by 5%.
#158794: In this PR xmakro improved dep graph read deduplication for instruction count reductions across multiple benchmarks, in the best case by 10%.
#159115: In this PR xmakro again improved dep graph read deduplication for instruction count reductions across many benchmarks, in the best case by 6%.
New trait solver
A lot of work is underway to get the new trait solver ready for release. This includes performance work. There is a lot going on and I’m not aware of most of it, but this Zulip thread is a good place to read if you are interested in learning more or helping.
The following image shows the progress on one of the new solver benchmarks.
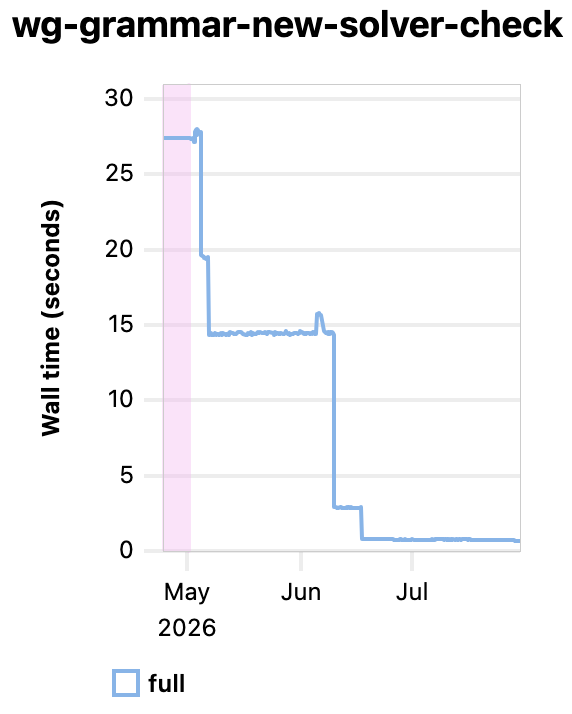
That’s right: the wall-time on this benchmark has dropped from 27 seconds to less than one second over the past three months.
#160005: I will mention this
one because it’s fun. lcnr pointed at a couple of
crates where the new trait solver was causing very large slowdowns. I used
Cachegrind to profile rustc compiling them and found that almost half the time
was spent in memcpy! This is very unusual, but when it happens DHAT’s copy
profiling
is unbelievably useful. There was a hot vector with an element type that was
136 bytes in size. LLVM uses memcpy (instead of generated instructions) to
move around any value with a size greater than 128 bytes. In this PR I (a)
avoided 2/3 of the moves, and (b) shrank the type down to 104 bytes so that
memcpy wasn’t used for the remaining moves. This reduced wall-times for the
two worst crates by 40%.
New contributors
There has been a welcome uptick in the amount of performance work being done recently and I want to highlight two newcomers. The first is xmakro, who was mentioned four times above. The second is arya dradjica, the creator of Krabby, an experimental Rust compiler focused on speed. arya is now getting financial support to work on both Krabby and rustc. arya’s rustc work is currently focused on macro expansion, where she has already made a few small performance improvements (e.g. #158976, #158974, and #158577) and she has ideas for many more. Check out her recent RustWeek talk if you want to know how much she loves optimizing things. (Spoiler: a lot.)
LLMs
They’re getting a lot of attention, aren’t they? Anyway, enough about that.
AST
#158942: In this PR I shrank the size of some AST nodes by removing a field. The removed data, when needed, is now stored temporarily to the side. This gave mostly sub-1% reductions in instruction counts.
#158720: The previous PR paved the way for this PR, in which I shrank the size of AST expression nodes from 72 bytes to 64 bytes. (Small enough to fit in a cache line.) Expressions are by far the most common AST node kind, and this change reduced wall-time on a small number of AST-heavy benchmarks, some by more than 10%. Cache miss rates on those same benchmarks fell by as much as 29%. I remember a few years ago when AST expression nodes were 104 bytes. Good performance often comes from chip, chip, chipping away at things over the long term.
#159266: In this PR I overhauled the AST representation of attributes. It was mostly intended to be a code cleanup, though it did result in some sub-1% reductions in instruction counts.
Miscellaneous
#155678: In this PR aerooneqq merged several HIR-level queries into one, reducing instruction counts on many benchmarks, in the best cases by almost 3%.
Performance triage
I want to recognize the people who take turns at the weekly performance triage. This involves looking at all the merged PRs from the past week that affected performance (for both good and bad) and gathering additional information to help isolate and fix the performance regressions. It’s an unglamorous, semi-automated task that might seem like it could be fully automated, but I think it’s important that humans are involved.
Why? Because the benchmark suite is large and complicated, the measurements
aren’t always precise, and human involvement can be persuasive. It’s one thing
for a PR author to receive a message from a bot saying “this PR caused nine
benchmarks to regress”. It’s a very different thing to receive a message from
a human with domain expertise saying “you can ignore the first four because
those benchmarks have been noisy lately; you can ignore the next three because
the regressions are so small that they are insignificant; but you should look
at the last two because they’re real and significant and might be caused by
$REASON and do you have ideas on how to ameliorate that?”
So, thank you to the current triage crew: Mark Rousskov, Jonathan Brouwer, Matyáš Racek, and Jakub Beránek. (The 50% Czech representation is visible via diacritics.) And thank you also to the triage alumni: Felix Klock, Dylan MacKenzie, and Ryan Levick.
One last thing
Some personal news: I recently quit my job at VectorWare. Nothing dramatic; it just wasn’t the right fit for me. I am now pursuing opportunities to return to paid work on the Rust compiler. Wish me luck!