How to speed up the Rust compiler in August 2023
It has been five months since my last general update on the Rust compiler’s performance. Let’s see what has happened in that time.
Big wins
Let’s start with some big improvements. The information about metrics at the top of this post still applies.
#107925: Incremental compilation uses a hashing algorithm to detect when code fragments have changed and need recompilation. In this PR, @thomcc changed the algorithm from SipHash-2-4 to SipHash-1-3, which is faster and lower quality, but still good enough for the purposes of incremental compilation. (The Wikipedia page says “The recommended parameters are SipHash-2-4 for best performance, and SipHash-4-8 for conservative security. A few languages use Siphash-1-3 for performance at the risk of yet-unknown DoS attacks.” Incremental compilation seems like an unlikely target for such attacks.) This gave a mean wall-time reduction of 1.63% across all benchmark results, with the improvements mostly coming in incremental builds.
#109474: In this PR, @nikic upgraded the LLVM version used by the compiler to LLVM 16. This gave a mean wall-time reduction of 1.19% across all benchmark results. It’s unclear how much of the improvement is because LLVM itself is faster (which would make rustc’s back-end faster) and how much is because LLVM is producing higher quality code (which would make all of rustc faster). Either way, it’s great work by the LLVM developers!
(Update) #114048: I overlooked that the upgrade to LLVM 17 occurred just two weeks ago. It resulted in a mean wall-time reduction of 1.91% across all benchmark results!
#113734: In this PR, @cjgillot tweaked how some lints are run. This gave a mean wall-time reduction of 1.05% across all benchmark results, with the improvements mostly coming in incremental builds.
Any change that results in a 1% across-the-board win is a big improvement, so it’s great to see three of them. (I pay close attention but it’s possible that I have overlooked other big improvements.)
Codegen units
I spent a lot of time trying to improve the parallelization done by the Rust compiler’s back-end, without much success. A lot of the work related to how the compiler breaks code into chunks for parallel processing, and how it must predict how long these chunks will take to compile. I did get two wins of note.
#112448: In this PR I introduced a minimum CGU size in non-incremental builds. This reduced peak memory usage across several benchmarks by up to 19%, with most of the improvements in the 2-9% range. It also reduced binary sizes by 48% in one extreme example, and up to 8% across numerous other benchmarks.
#113777: In this PR I adjusted the CGU merging algorithm to minimize the duplication of inlined functions, giving icount, peak memory, and binary size wins of a few percent on several benchmarks.
I wrote in more detail about my efforts in a blog post in July. In the Reddit discussion several people suggested data analysis to improve the estimates. So I collected data, put it in another blog post, and requested assistance because I am no data scientist. I got some excellent responses, many of which suggested that larger data sets would be helpful. I then published a follow-up blog post with larger data sets, and received some more good responses. For people interested in compilers and data science there will be plenty of interesting reading there.
Unfortunately, I wasn’t able to improve the compiler further, despite trying a number of different estimation functions from the analyses. Normally when you implement a parallel algorithm, the exact way you divide the problem into pieces doesn’t affect the answer. But that isn’t true for codegen unit formation! The functionality of the generated code doesn’t change, but the quality of that code (and its size) can very much change. This makes it really challenging to improve, because there are multiple metrics in conflict. Almost any change that improves one metric regresses another. It’s quite possible that there are potential improvements remaining, but I don’t know how to attain them, and I’m not planning on working on this area any further.
Other presentations
Jakub Beránek has been extremely productive recently, and published multiple interesting blog posts describing his work.
- One about his improvements to the CI used for rustc, some of which sped up the compiler.
- One about the rustc-perf benchmark suite that we use to measure the compiler’s performance.
- One about cargo-remark, an experimental tool to help you understand how your Rust code is being optimized by LLVM.
- One about cargo-pgo, which makes it easier to use PGO and BOLT to speed up your Rust programs.
He also got a new runtime benchmarking suite up and running within rustc-perf, to complement the existing compile-time benchmarking suite. This is a long-desired feature that is now running on every merge. It’s still experimental and the benchmarks could be improved, but it’s a huge step towards reliable detection of changes to codegen quality. I believe Jakub will write a new blog post about this soon.
Finally, I gave a short talk at RustNL 2023 about parallelism in the compiler. It’s a nice overview, but please note that my estimate of “next month” for the parallel front-end was too optimistic. I have learned my lesson, and I won’t give a new prediction for when that feature will ship.
My improvements
#110527: In this PR I avoided constructing a data structure when it wasn’t necessary, for a few sub-1% icount wins.
#111088: The compiler has a
FileEncoder type used for writing various things to file. It has an internal
buffer that had a variable size, but in practice the buffer size was always 8
KiB. In this PR I fixed the size to 8 KiB, which meant some checks could be
hardwired in the generated code, giving sub-1% icount wins on a few benchmarks.
#111963: The compiler can
derive impls for various built-in traits: Clone, Default, Debug,
PartialEq/Eq, PartialOrd/Ord, and Hash. The derived functions were
marked #[inline], except for Debug::fmt (which makes sense given that it is
typically not used on hot code paths) and Hash::hash. This PR added an inline
marking to Hash::hash, giving sub-1% icount wins on a number of benchmarks.
#113116: In this PR I made a series of micro-optimizations in and around codegen unit formation, giving sub-3% icount wins on a few benchmarks.
#113609: In this PR I added a cache that avoids the need for some repetitive HIR traversals during linting. It gave icount wins of up to 6% across a number of benchmarks.
#114611: This is a fun one. @Dragon-Hatcher created a very unusual Rust program: a chess engine that computes things at compile time only using Rust’s Turing-complete trait system. (They also have a TypeScript version of the same program.) This causes vast numbers of trait obligations to be generated for the compiler’s trait solver. In this PR I made some small changes to a de-duplication step that runs on collections of these obligations, which reduced both the compile time and peak memory usage of this crate by almost 7x! It also gave icount wins of up to 4% across a number of secondary benchmarks.
Finally, it’s worth noting that some recent improvements I made to Cachegrind, were very helpful with all of the above PRs. I wrote about these changes in a previous post.
General Progress
For the period 2023-03-22 to 2023-08-24 we had some excellent overall performance results.
First, wall-time:
- There were 513 results measured across 42 benchmarks.
- 454 of these were improvements, and 59 were regressions. The mean change was a reduction of 7.13%, and many of the reductions were in the double digits.
Next, peak memory usage:
- Again, there were 513 results measured across 42 benchmarks.
- 492 of these were improvements, and 21 were regressions. The mean change was a 10.53% reduction, and many of the reductions were again in the double digits.
Finally, binary size:
- There were 316 results measured across 42 benchmarks.
- 178 of these were improvements, and 138 were regressions. The mean change was a 0.02% reduction, i.e. the wins and losses balanced out. Most of the changes were in the single digits.
- If we restrict things to non-incremental release builds, which is probably the most interesting case for binary size, there were 24 improvements, 18 regressions, and the mean change was a reduction of 2.65%.
For all three metrics, all but a handful of results met the significance threshold. I haven’t bothered separating those results because they made little difference to the headline numbers. As always, these measurements are done on Linux.
Overall these are excellent results which will translate into meaningful speed and memory usage improvements for many Rust users, and continue a long line of steady improvements over a number of years. Thank you to everyone who contributed!
Bigger improvements?
In a Reddit discussion one person questioned the value of incremental improvements.
I would like to ask: are optimizations like these the right path forward?
I don’t mean to diminish your work, i’ve been reading your posts for a long time and i know a lot of effort goes into improving rustc and how many experiments don’t pan out but i always get the impression that even when they do, it’s a couple percent at most and often only on specific benchmarks.
This doesn’t seem to be the path towards the 10x improvements which many people wish for. Is something like that even possible and what architectural changes would be necessary?
I admit this question tested my patience. (Have I thought of making big improvements instead of small improvements? Yes. Yes, I have.) But I will assume it was asked in good faith, and provide some thoughts in response.
Anyone waiting for 10x improvements is likely to be disappointed. I don’t see that happening, except for the occasional unusual program (such as the chess engine case mentioned above).
The compiler is a large, mature project. It’s well over 10 years old, and hundreds of thousands of lines. Projects like that tend to not get quantum leaps in performance. Many small improvements is more typical.
Rust is a difficult language to compile quickly. Brian Anderson has a whole series of blog posts about this: 1, 2, 3, 4. Some of the points made are now out of date, and I find the overall a tone a little sensationalistic, but there is some truth to it. In short, there were numerous design trade-offs made during Rust’s design, and compile times got the short end of the stick almost every time.
There have been a number of large improvements in the past, and there may be some more coming. There have also been some failed attempts at large improvements.
- Incremental compilation can make a huge difference, perhaps not 10x, but certainly 3-5x in many cases. The implementation has its issues (it has been temporarily disabled a couple of times due to bugs) but many people are benefiting from it every day.
- The parallel back-end makes a huge difference. Try compiling with
codegen-units=1and you’ll get slightly higher code quality but it might take 2x or more longer. There are many trade-offs with this kind of thing, though, as I touched on earlier. - Pipelined compilation greatly increased inter-procedural parallelism, giving speedups of up to 1.8x.
- The parallel front-end is under active development, and will hopefully be shipped soon. We have seen 2x speedups in some cases. Getting it working has been a multi-year effort; it’s a difficult project.
- The Cranelift backend has been in development for a number of years. A primary goal is to improve compile times. It is a large piece of work, and is still experimental.
- Polymorphization is an optimization that aims to reduce the cost of monomorphization of generic code. There is a partial implementation that provide modest speed improvements and is not stable enough to be on by default. I think this is basically because compilers are complex and sometimes reasonable ideas are just really hard to get working.
Compilers involve giant tree structures, with lots of allocations, pointer chasing, and data-dependent multi-way branches. All the things that modern microarchitectures handle poorly. There is research into different designs that avoid these problems, but they involve data structures that can be highly non-ergonomic. And it’s hard to radically change the data structures used in a mature compiler.
All of this ignores what might be called performance “dark matter”: the many bug fixes and functional improvements that have gone into the compiler without regressing performance. (Or that did slightly regress performance, but which have been balanced out by other improvements.) A great example of this is the NLL borrow checker that shippped in 2018, which I think is the single biggest improvement to Rust since 1.0. It was performance neutral, but only because a great deal of work went into its performance before shipping, which resulted in some cases reducing compile times and peak memory use by 50x. Another good example is the excellent error messages that the compiler is famous for; a lot of care goes into keeping those as cheap as possible.
I’m a firm believer that small improvements add up, in just about any part of life, and compiler performance is no difference. I have a knack for finding these improvements and the persistence to keep at it. I’ve been writing these posts for a long time, and I typically report 3-10% improvements every 3-6 months, due to my work and that of many others. Visit the performance dashboard and you’ll see things like this:
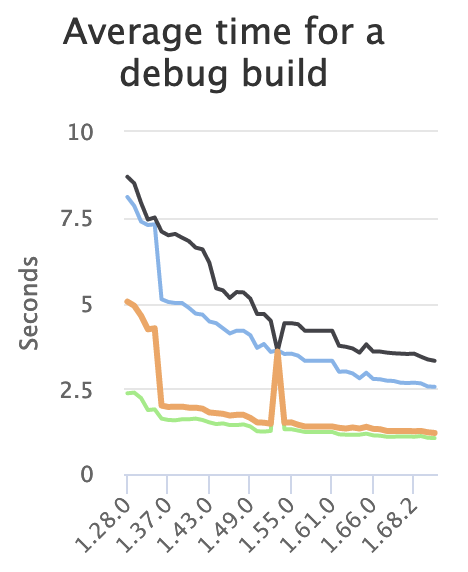
The improvements over time have been consistent enough that there has been discussion about whether the y-axis scale on these graphs should be linear or logarithmic. I’d love to have 10x wins, but in their absence, a steady grind of small improvements is absolutely worthwhile.